
When trading through the Pocket Option platform, indicators play a key role. These technical analysis tools provide basic signals that allow you to select both the optimal point to enter the market and predict the direction of price movement for a selected time interval. Both factors determine the success of binary options trading. In addition, when working with the Pocket Option platform, technical analysis turns out to be more effective than fundamental analysis. The latter generally does not apply to this form of trading.
Content:
- Rules for Selecting Indicators in Pocket Option;
- Pocket Option Indicators in the Mobile Version;
- Indicators in the Pocket Option Trading Platform;
- Accelerator Oscillator;
- ADX;
- Alligator;
- Aroon;
- Average True Range;
- Awesome Oscillator;
- Bears Power;
- Bulls Power;
- Bollinger Bands;
- Bollinger Bands Width;
- CCI;
- Donchian Channel;
- DeMarker;
- Envelopes;
- Fractals;
- Ichimoku Kinko Hyo;
- Keltner Channel;
- MACD;
- Momentum;
- moving average;
- OsMA;
- Parabolic SAR;
- RSI;
- Rate of Change;
- Schaff Trend Cycle;
- Stochastic Oscillator;
- SuperTrend;
- Vortex;
- Williams %R;
- ZigZag;
- Examples of Using Pocket Option Indicators.
Rules for Selecting Indicators in Pocket Option
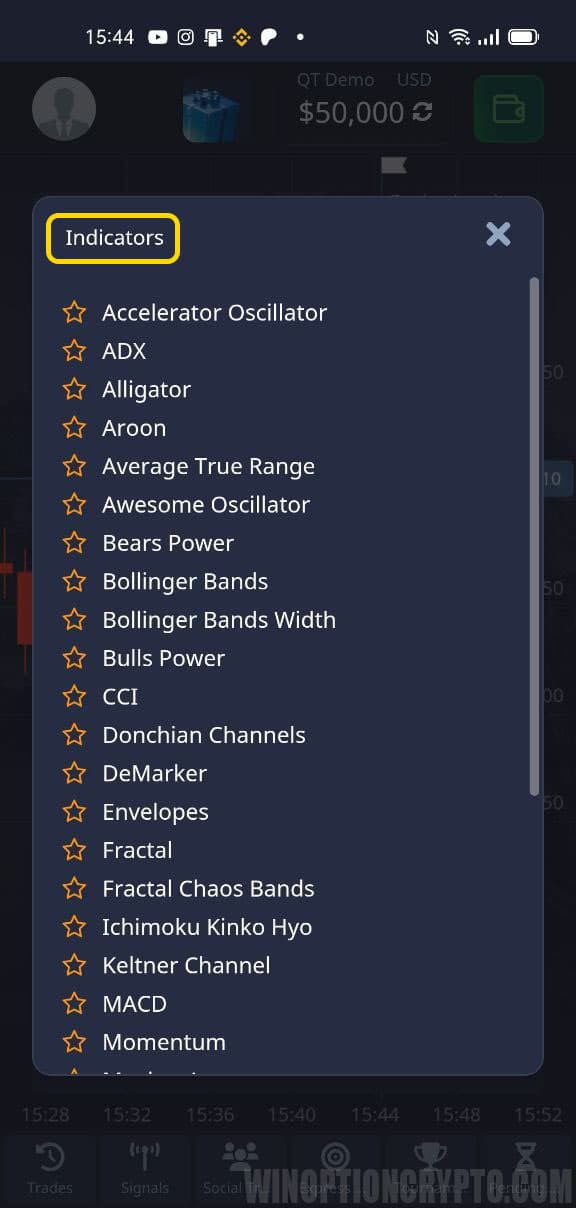
After launching the trading platform and selecting a suitable asset, you can specify the type of function suitable for a given strategy by clicking on the button of the same name located on the working screen. After this, a new window appears containing a complete list of options:
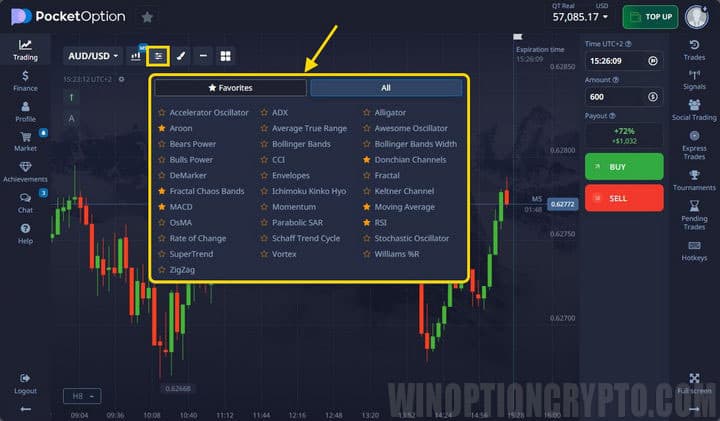
The set of indicators in the broker terminal is presented in sufficient quantity (in comparison with other companies). Traders have access to 32 technical analysis tools, including:
- standard trending;
- oscillators;
- channel;
- complex (ZigZag, fractals, Ichimoku);
- binary options popular among speculators ( Schaff Trend Cycle, Vortex).
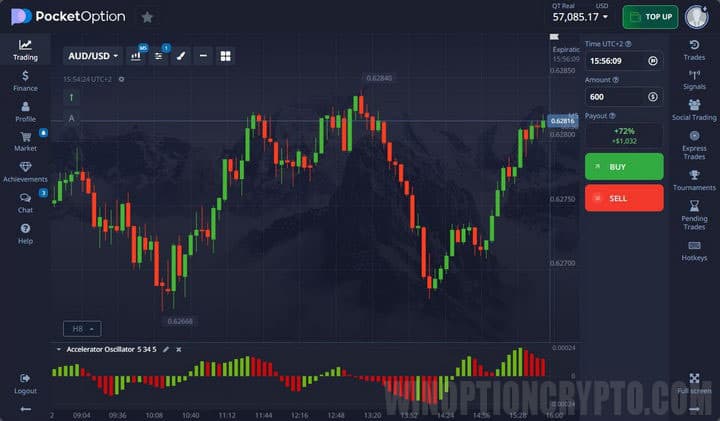
To transfer the indicator to the terminal, you need to click on the name once. After that it appears on the chart. For settings you need to click on the “pencil” icon:
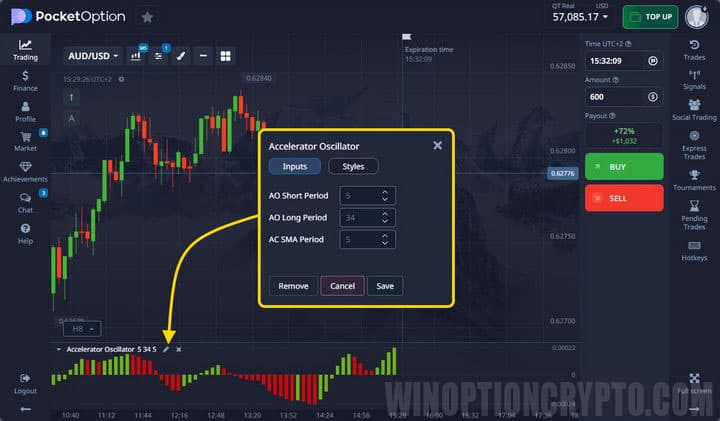
Upon completion of the described actions, a new chart is displayed on the terminal screen. All instruments have a standard arrangement. In particular, oscillators are moved to the “basement” of the chart.
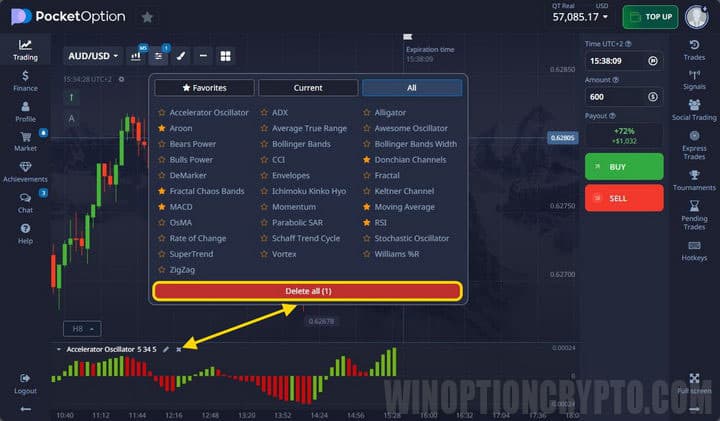
If necessary, traders can change the settings again. The Pocket Option platform allows you to simultaneously use advanced tools , selecting the desired charts and changing the position of the latter, taking into account personal preferences.
The list of active indicators is given in the section of the same name. The user can remove one or all analysis tools from the chart by clicking on the corresponding button (cross or “remove all”):
Pocket Option Indicators in the Mobile Version
The broker offers traders a mobile version of the trading terminal, which is not inferior in functionality to a computer one. But upon closer examination, both options differ from each other.
To make changes to the graphic display of selected functions in this terminal, you must click on the same button located on the main screen:
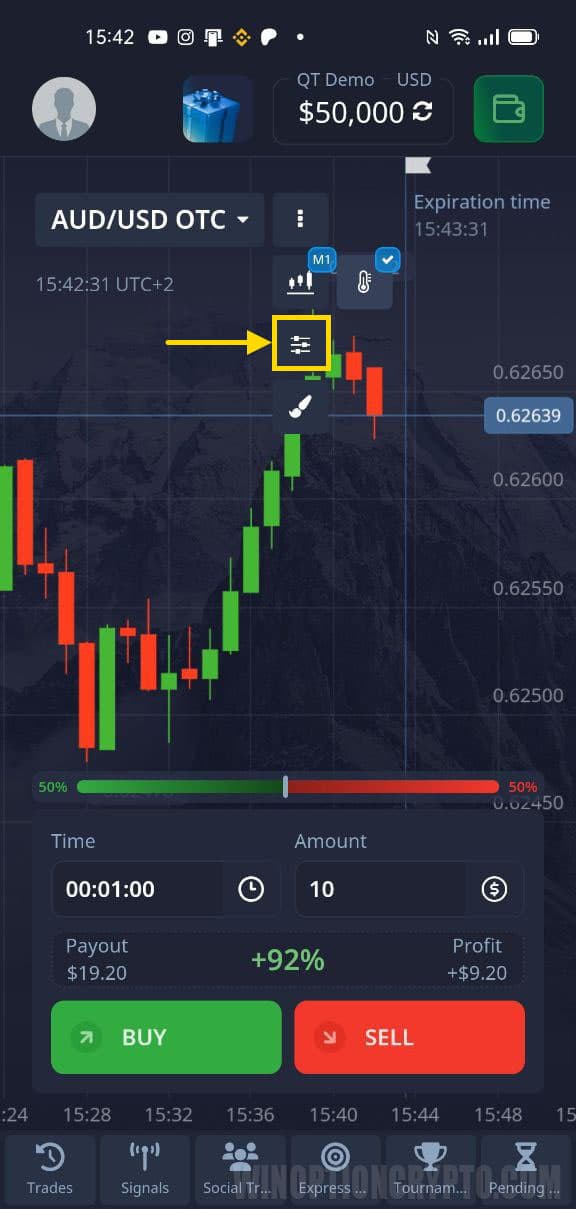
Compared to the online version, the mobile trading platform offers fewer options for technical analysis:
- CCI;
- Bollinger Bands;
- ADX;
- Rate of Change;
- MACD;
- SMA;
- RSI;
- Stochastic.
Setting up in the mobile application is carried out differently. When selected, a list appears with available options. After reconfiguration, the indicator is automatically transferred to the chart:
The list of open indicators is displayed in the “Active” section. In this window you can delete part or all of the indicators displayed on the chart.
The mobile version of the trading platform has limited functionality of some of the technical tools. In particular, the maximum period of a standard moving average cannot exceed 35. In the online platform, this parameter reaches 250. Also in the mobile version there is no possibility of copying through social trading Pocket Option.
In addition, training materials are available through the online platform. Therefore, it is recommended to use the mobile version only to track price fluctuations on the market.
Indicators in the Pocket Option Trading Platform
In the company's terminal you can find various indicators, which are both basic and proprietary. Therefore, here you can find some that will not be in MetaTrader 4. Next, let's look at each of them in more detail.
Accelerator Oscillator
AO calculates the acceleration and deceleration of price movement, thereby measuring both the movement itself and the price. It also has a mid-range that acts as a balance between acceleration and power. When the readings are higher than it, it is easier for quotes to rise, and when they are lower, it is easier to fall.
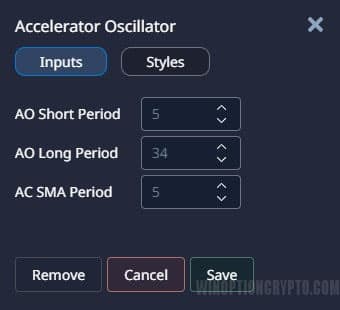
Indicator settings allow you to get more frequent or rarer signals:
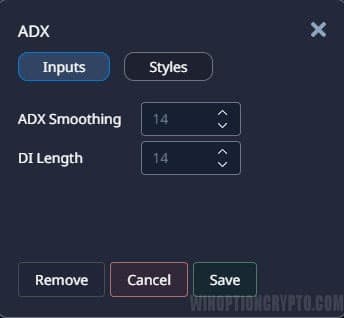
ADX
Average Directional Movement Index is a directional movement indicator consisting of three lines. The algorithm compares the highs (+DI) and lows (-DI) of the price, building a “moving average” (third line) based on them.
Based on this, ADX makes it possible to determine the direction of movement, as well as its strength. By -DI or +DI we see the direction, and by the “moving average” we see the strength.
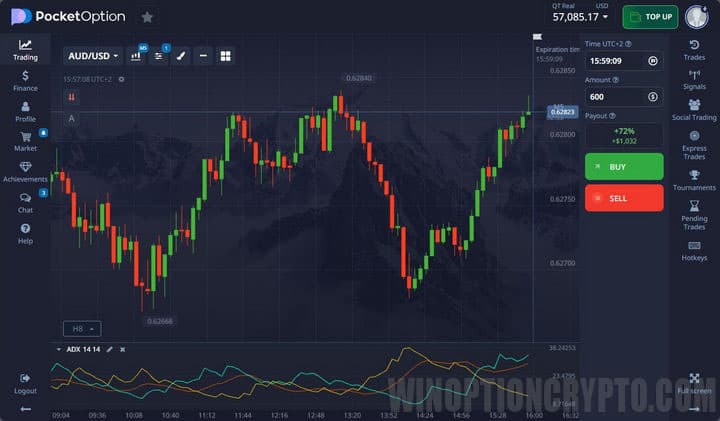
It is not necessary to change the settings, since the indicators do not give signals, but only inform about the trend:
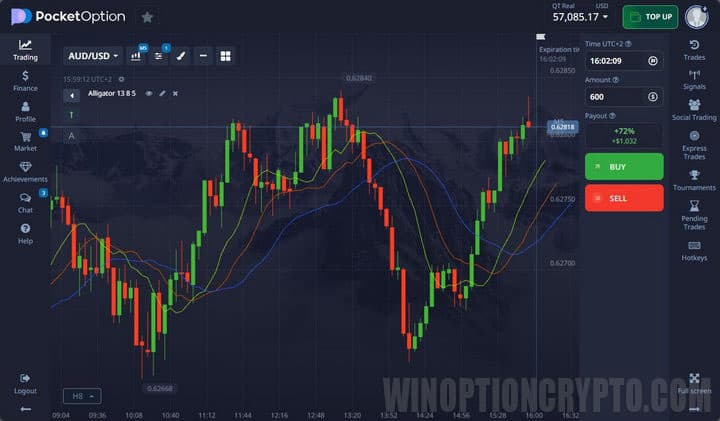
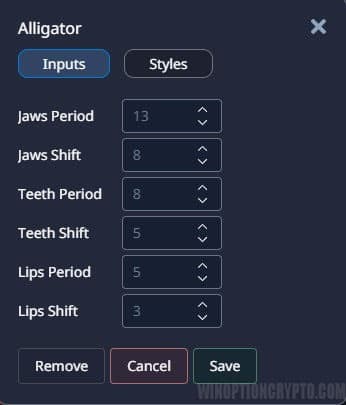
Alligator
The essence of the indicator is very simple - these are three smoothed moving averages with different periods and offsets. As a result, there are three components of the “crocodile”:
- Jaw – blue;
- Teeth – red;
- Lips are green.
If the lines intertwine with each other, then the animal is sleeping, that is, the market is in a flat. When the animal goes hunting, the mouth opens (the sliding ones expand), and the alligator eats, or, more simply, a trend begins. After satiation, the mouth closes again and he falls asleep (flat):
Basic settings can be changed, but this is not necessary:
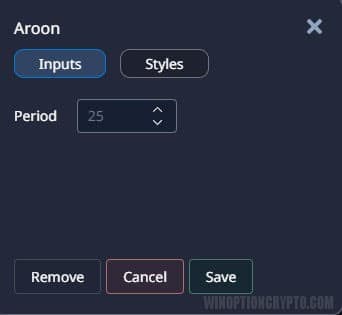
Aroon
The tool was created to determine the trend and the market transition to a flat state. Constructions are based on periods since the appearance of the last extreme. The period is set by the trader and by default is “25”. There is also a strategy for Pocket Option with this indicator called Aroon EMA.
If the red line is located above “70” and the blue line is below “30”, then we can talk about a bearish trend. Accordingly, a growing market can be seen under reverse conditions. A flat is determined when the lines stay near the middle.
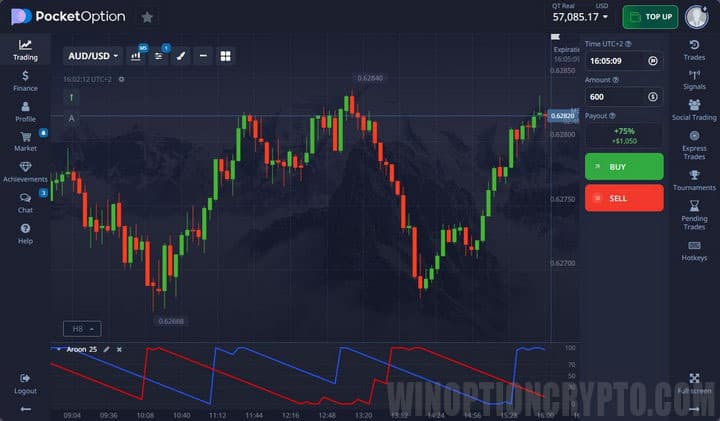
You can only configure the period:
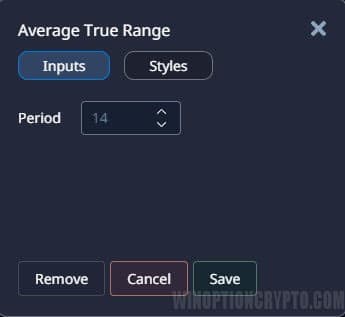
Average True Range
ATR shows the volatility of quotes. When the price falls sharply and strongly, the line rises, indicating that volatility is increasing. The same thing can happen with sudden growth. If the price is in a sideways movement for a long time, then volatility falls and the indicator line decreases.
It only makes sense to use ATR in trading to collect statistics and determine how much the price may rise or fall in the near future.
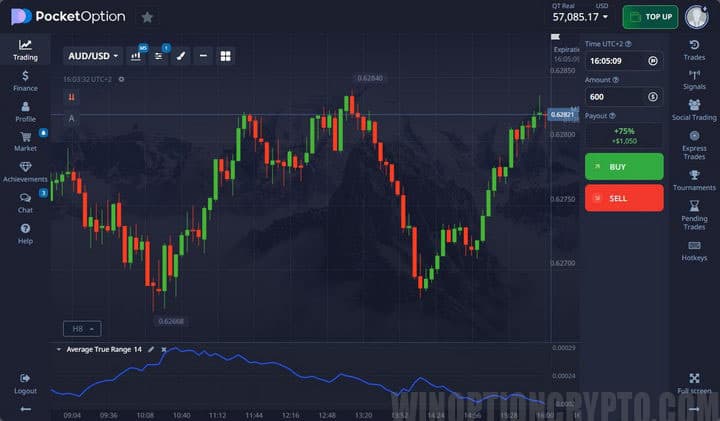
The period is responsible for the number of candles on the selected timeframe:
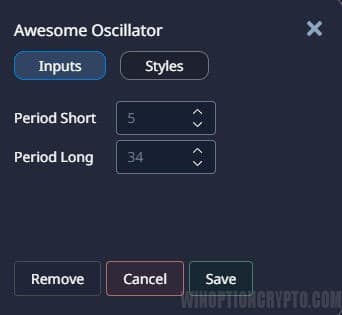
Awesome Oscillator
The indicator is built using the median prices (high + low / 2) for the large moving average, after which the median prices of the smaller moving average are subtracted from it. The main purpose of the tool is to determine market strength.
Trading is carried out according to the “saucer” pattern or when crossing the zero level. You can also look for divergences, which are shown well by the Awesome Oscillator Divergence.
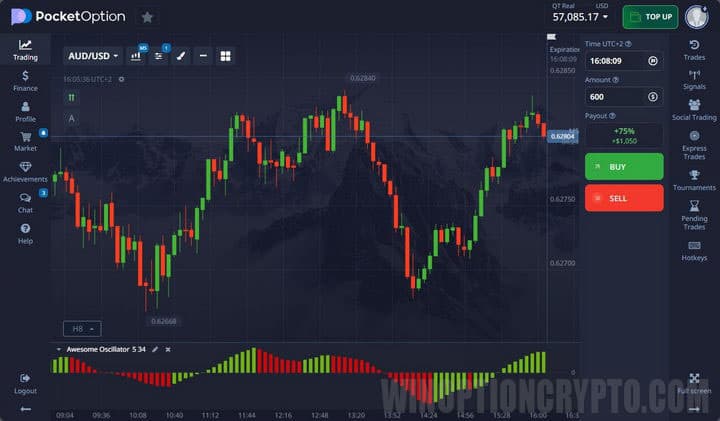
In the settings you can change the periods of moving averages:
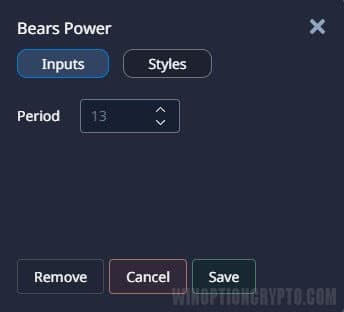
Bears Power
This indicator is the difference between price lows and the exponential moving average and allows you to see the strength of the bears. The best readings can be obtained by combining it with a standard moving average. If the moving average is directed upwards and Bears Power begins to grow, this acts as a signal for Call and vice versa for Put:
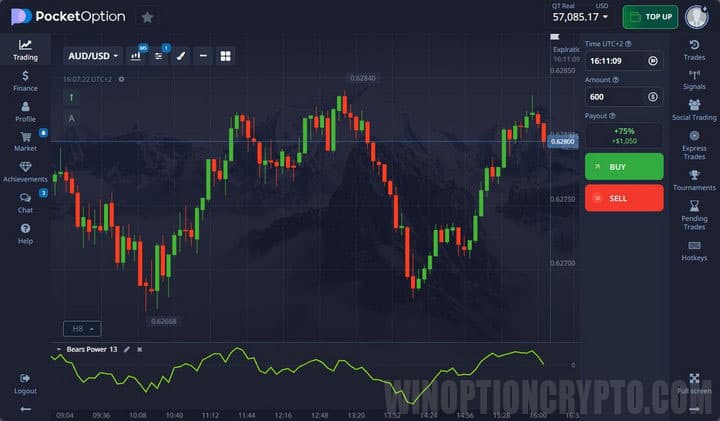
The period measures the strength of bears over an amount of time:
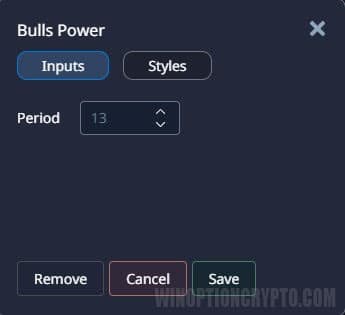
Bulls Power
Exactly the same indicator with the same calculation algorithm, but based on the strength of the bulls. In trading it is used in exactly the same way, and there is no point in combining them, since they are completely opposite:
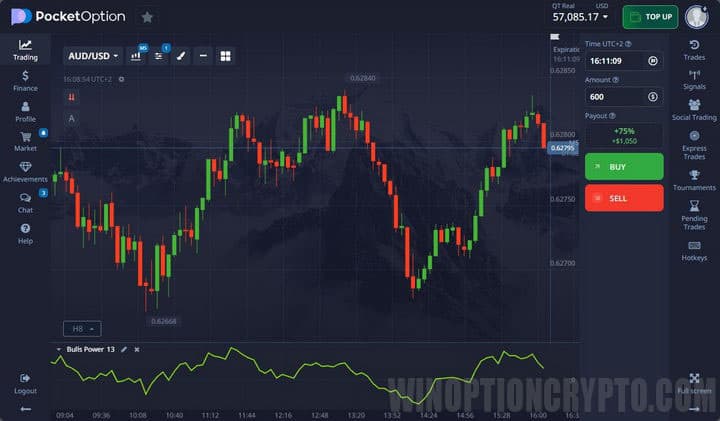
The settings are also responsible for the period in candles:
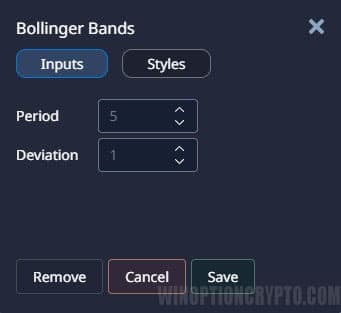
Bollinger Bands
BB includes a trend detection algorithm, volatility and an oscillator. The direction of the tapes shows the trend that prevails in the market, all taking into account volatility. The wider the channel, the higher the volatility. During a flat, the range narrows:
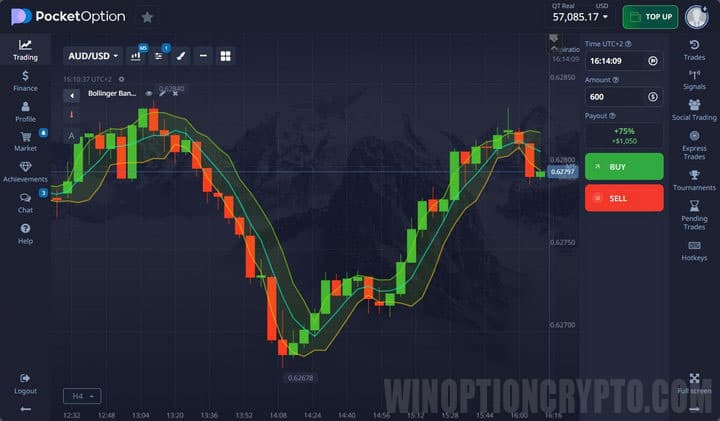
You can set the period in bars and deviation:
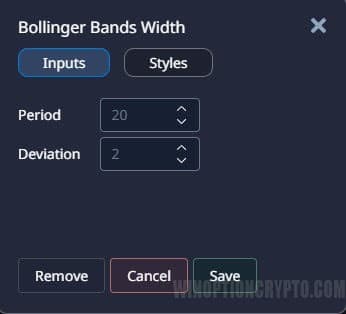
Bollinger Bands Width
This indicator is built using a different algorithm, unlike Bolinger Bands. But it also measures trend and volatility. Use it together with the basic indicator to receive more accurate instructions and signals:
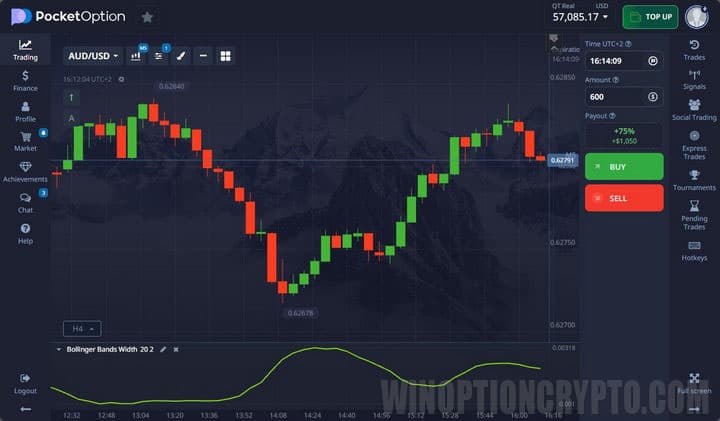
The settings are similar to the previous option:
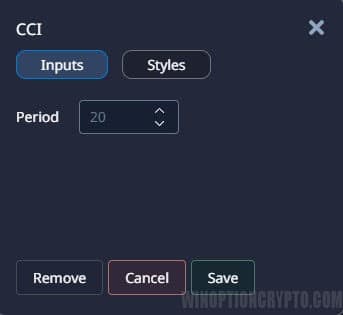
CCI
CCI is an oscillator that helps determine overbought and oversold conditions by showing price deviation from the moving average. If the line goes beyond “100” and “-100”, this acts as a standard signal, although the use of this tool is not limited to such simple rules and there are many strategies based specifically on the Commodity Channel Index:
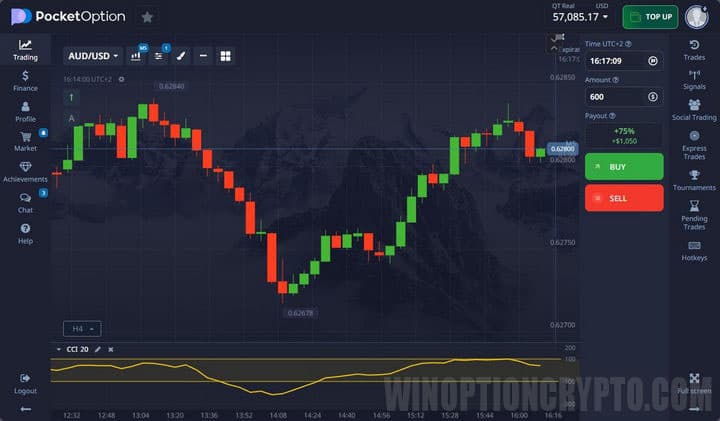
In the settings, you set the period of the moving average, from which the price deviates:
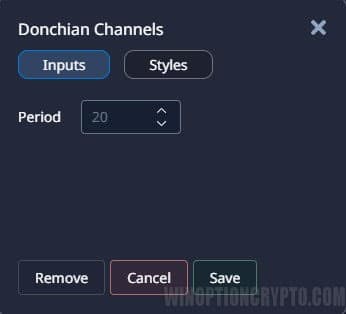
Donchian Channel
Donchian Channel is a channel that is built using maximum and minimum prices for a given period of time. Trading is carried out after the channel breaks out in the corresponding direction. You can also use the middle line of the channel:
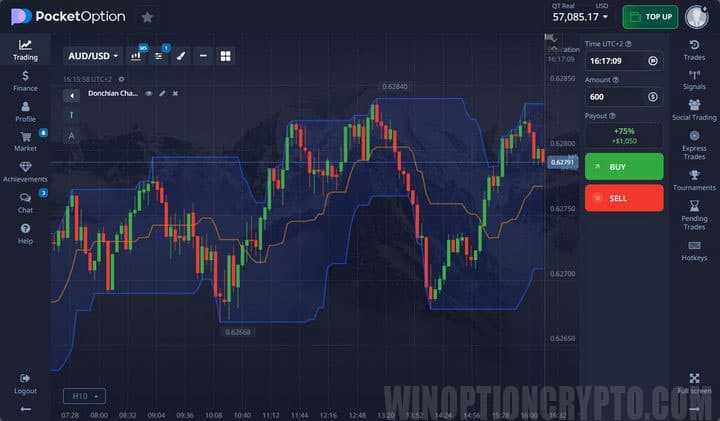
Period for calculating max. and min.:
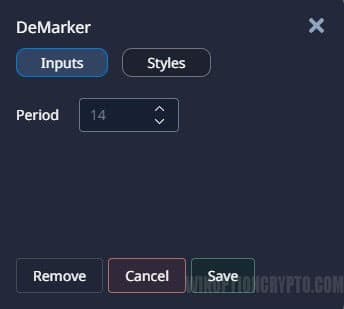
DeMarker
According to the algorithm, DeM is similar to Donchian channels, but compares past extremes with current ones. It is located in the “basement”, and based on its calculations, it indicates the direction of the trend and overbought/oversold.
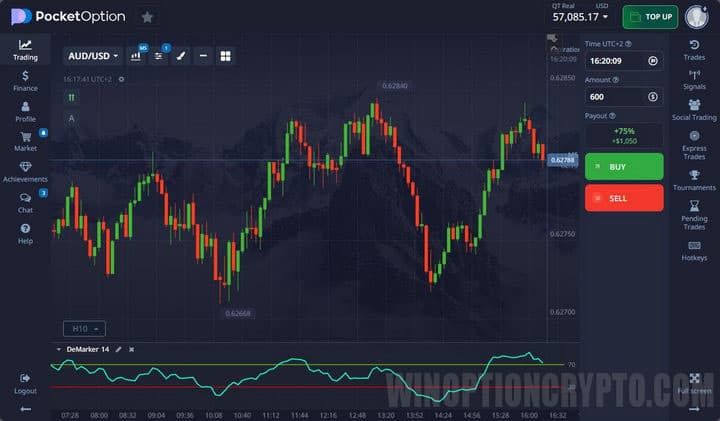
Calculation periods can be changed in the settings:
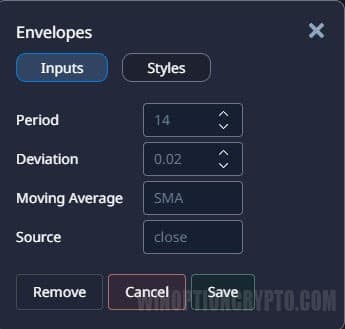
Envelopes
It is also called “envelopes”. It is based on the fact that any price in most cases returns to its range of movements, and therefore, as soon as the price breaks through the channel border, it should return to the channel in the near future. Trading is carried out after the channel breaks out and also when the price crosses the middle line.
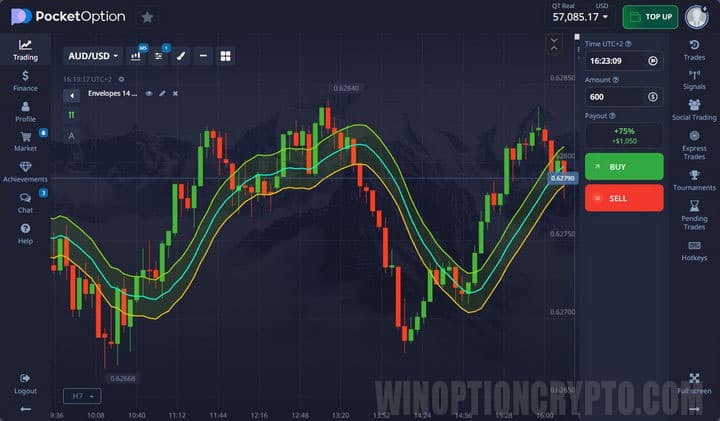
Since the channel consists of “masks”, they can be configured:
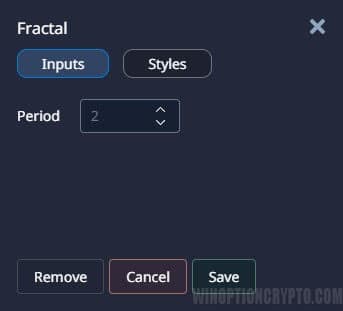
Fractals
The indicator algorithm is based on 5 consecutive candles, where the middle candle (third), which is the highest or lowest, is taken as a basis. The fractal appears exactly under or above the third candle.
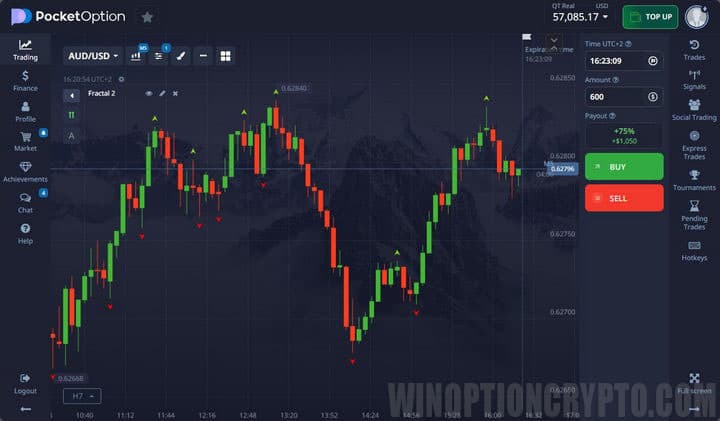
It is better not to change the settings, so as not to “break” the standard construction principle:
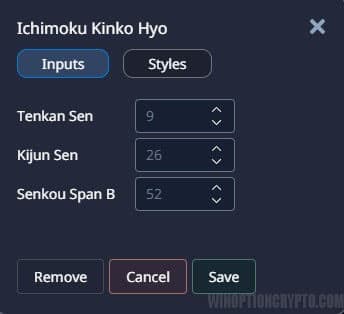
Ichimoku Kinko Hyo
Quite an old indicator created by a Japanese trader. Ichimoku helps determine the trend, support and resistance levels, and entry points into a trade. The tool consists of three lines and a cloud:
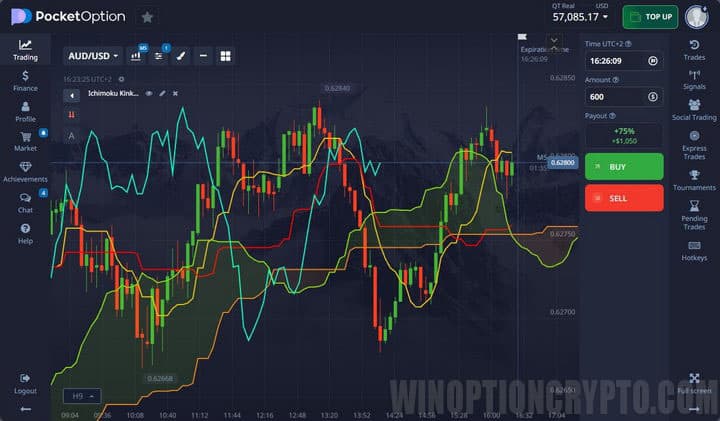
You can customize the periods of lines and colors:
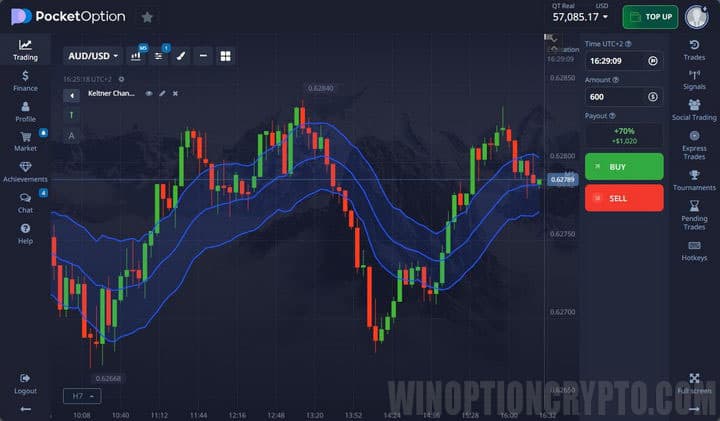
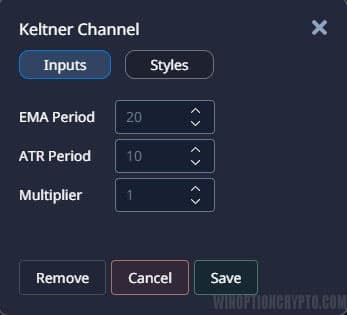
Keltner Channel
The Keltner Channel is a simple moving average with a range above and below this line, which is what creates the channel. ATR is also included in the calculation. Trading using the indicator is carried out when the boundaries are broken, as this indicates a bullish or bearish trend:
You can configure the moving period and ATR:
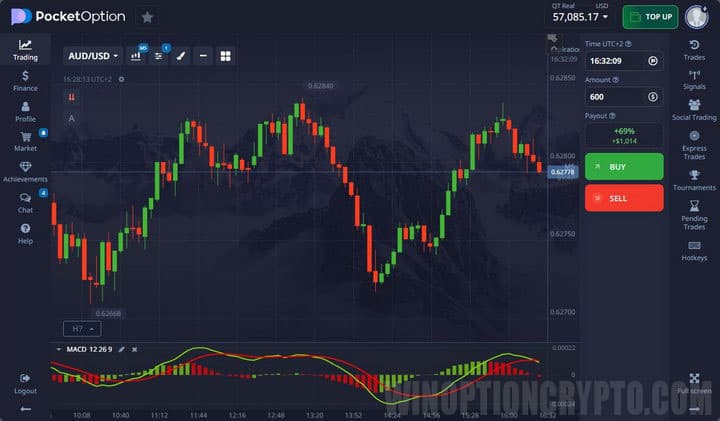
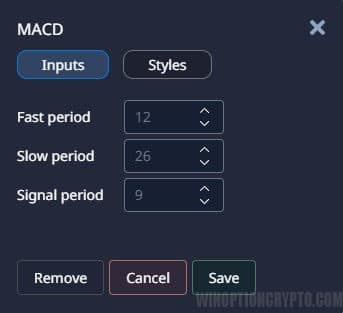
MACD
MACD is a trend oscillator as it is based on two Moving Averages. When one of the moving averages moves away from the other, the histogram grows, and when the moving averages get closer, the histogram falls. Based on this, during a trend the indicator bars are high, and during a flat they are low:
You can configure the periods of “waves” and the signal line:
Momentum
Momentum measures the amount of change in quotes over a given period, making it a leading indicator. Signals for Call appear when Momentum is at its minimum values and begins to grow. Put is bought when the indicator begins to fall after its maximum values:
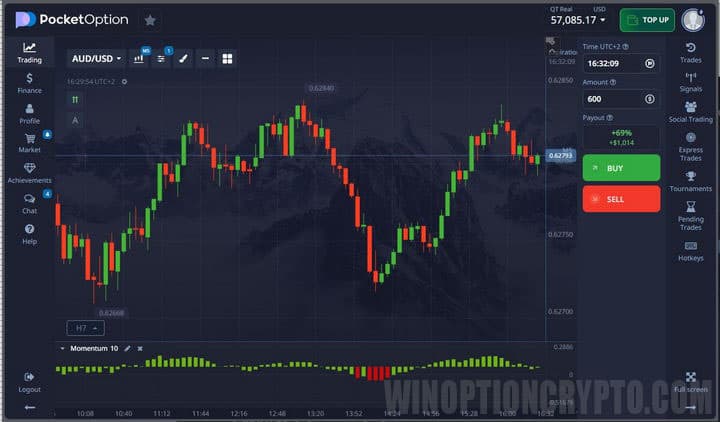
The period for which the magnitude of movement is measured is configured:

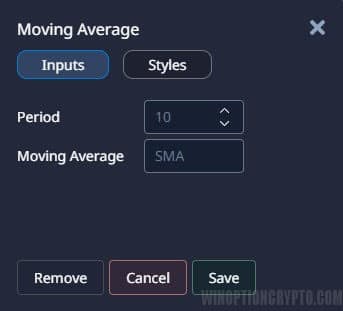
Moving Average
Moving Average shows the average price value for the selected time period. Accordingly, it can rise or fall following the price. There are different types of moving averages and therefore can show different values, but the most popular is the simple average:
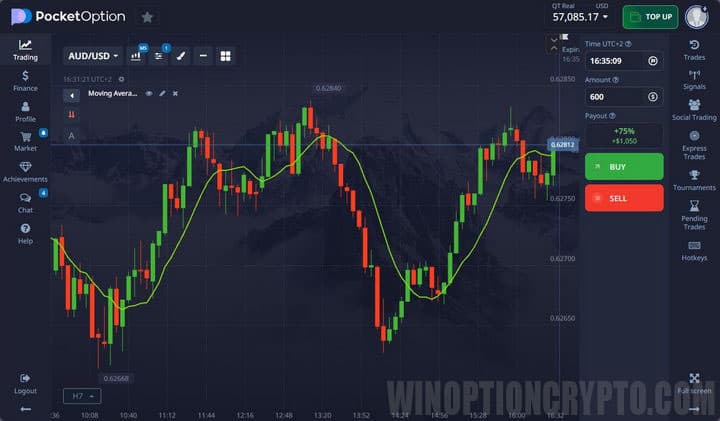
You can configure the period for which the indicator will measure movement and the type of average:
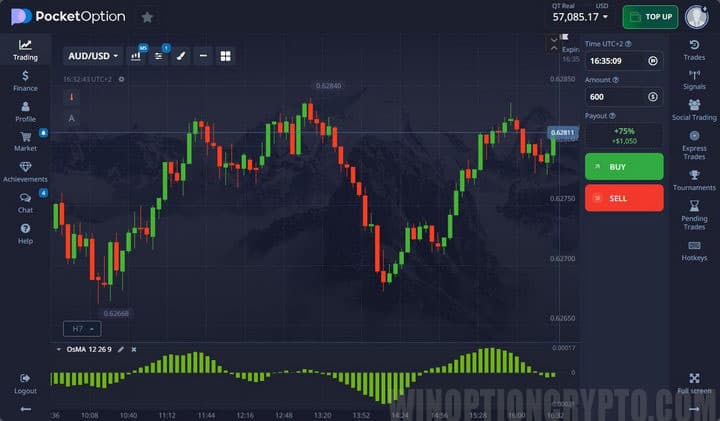
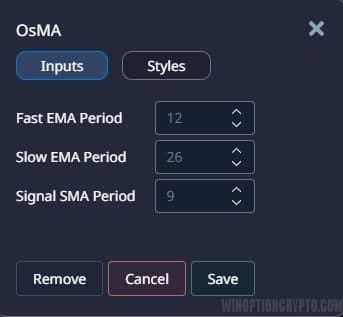
OsMA
OsMA is a derivative indicator from MACD that shows the divergence between the Makdi and its histogram. When MACD is above its line, then OsMA is above zero, and vice versa:
The settings are exactly the same as for MACD:
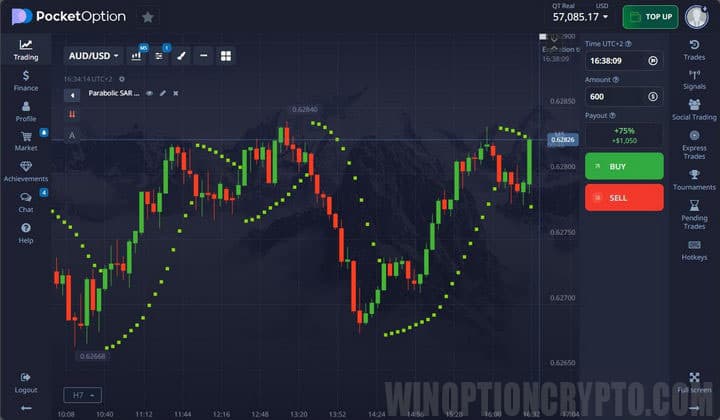
Parabolic SAR
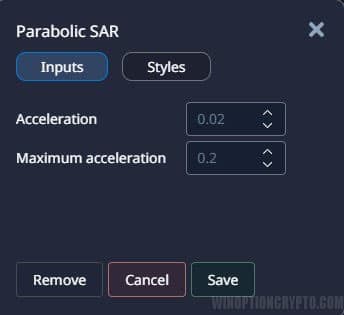
A trend indicator that shows a change in trend. The construction is based on each candle. When constructing the indicator, the factor and acceleration point are used. The factor is standardly equal to 0.02% and when the candle closes, the same value is added to the indicators. The acceleration point is standard 0.2%:
The settings discussed above can be changed:
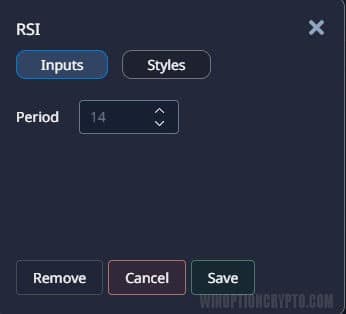
RSI
A very popular indicator that has long been used by many traders to search for market overheating and divergences. The indicator is based on comparing two price indicators for the same period of time:
- price drop;
- price increase.
As a result, the oscillator line is constructed:
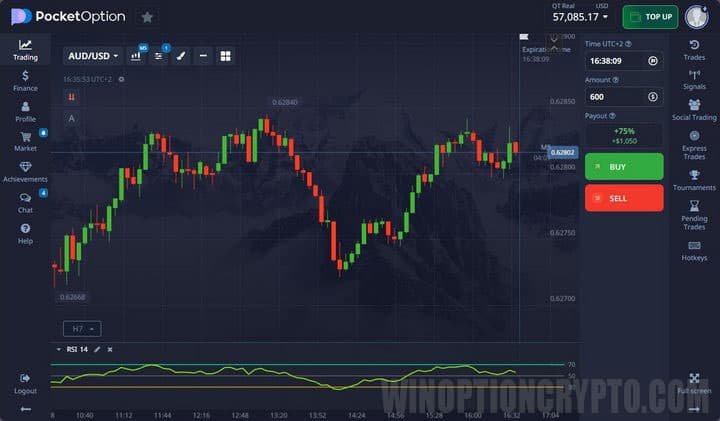
You can configure the indicator period for calculations:
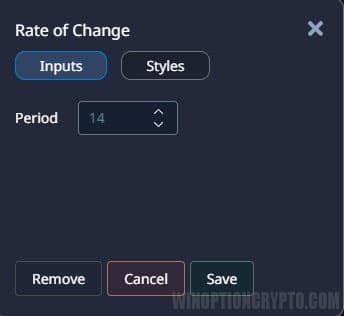
Rate of Change
The values of the RoC indicator show how strong sellers or buyers are at the moment. The indicator is a duplicate of Momentum, but depends not on the levels “100” and “-100”, but on the level “0”:
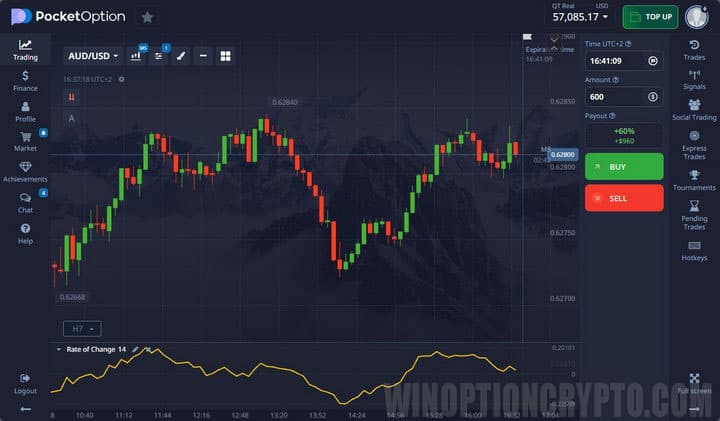
The period for which the indicator is built can be changed in the settings:
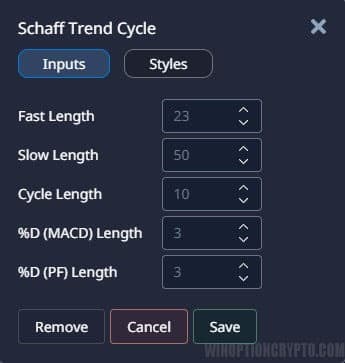
Schaff Trend Cycle
STC includes algorithms for indicators such as MACD and Stochastic. Initially, Schaff Trend Cycle calculates the divergence between two EMAs (like MACD), after which the stochastic algorithm smooths out these values:
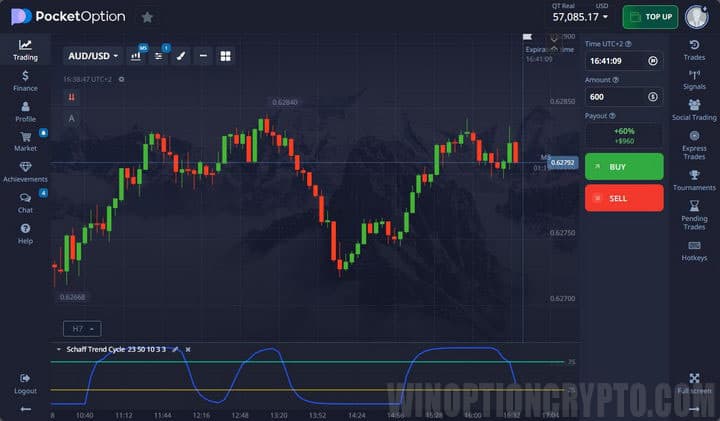
The indicator settings allow you to change various data:
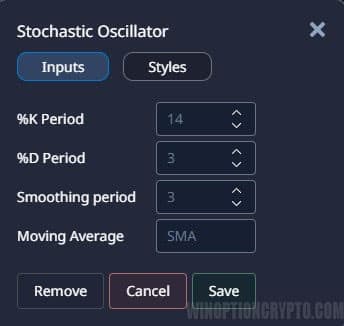
Stochastic Oscillator
This oscillator is built based on the highs and lows of closing prices. But this is only the first line of the indicator. The second line is built on the basis of the first line, after which a fairly dynamic indicator of overbought and oversold is obtained. Trading is carried out either when leaving these zones, or based on divergences:
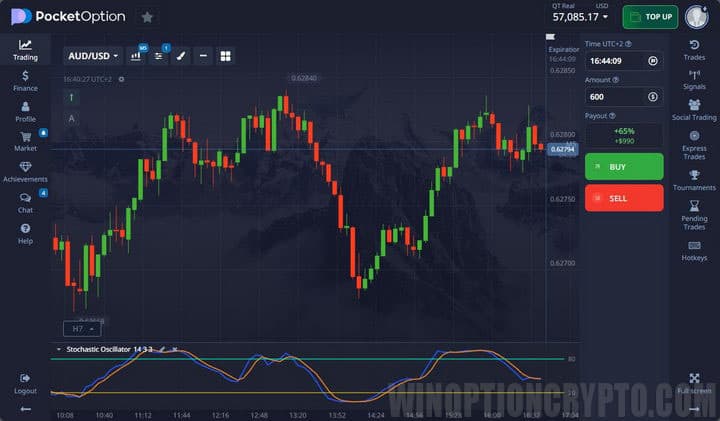
You can configure periods and deceleration, and also select the type of moving averages:
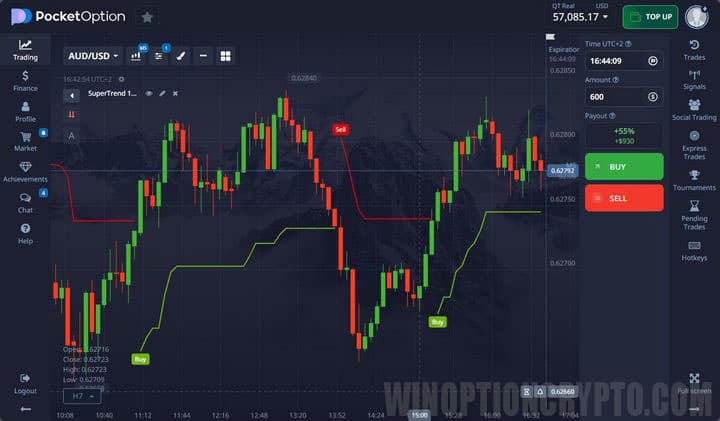
SuperTrend
The SuperTrend indicator helps determine the trend and is not intended for trading, as it does not provide any signals. Its readings are based on the closing price and are based on ATR. If the price rises, it will show a green line labeled "Higher". When falling, a red line and the signature “Below” will appear:
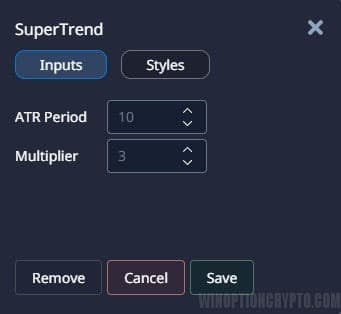
In the settings you can change the ATR period and multiplier:
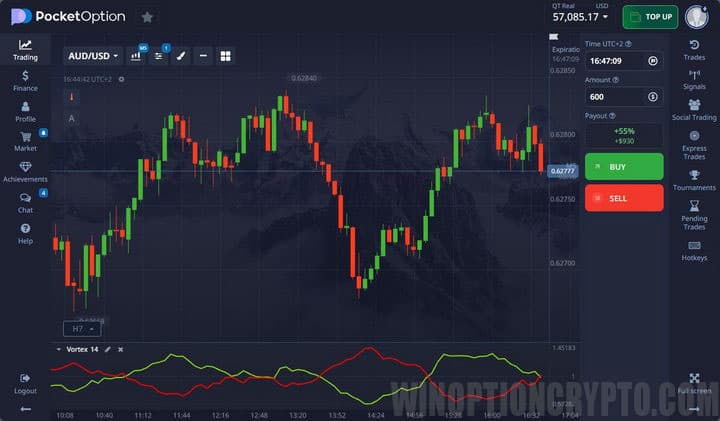
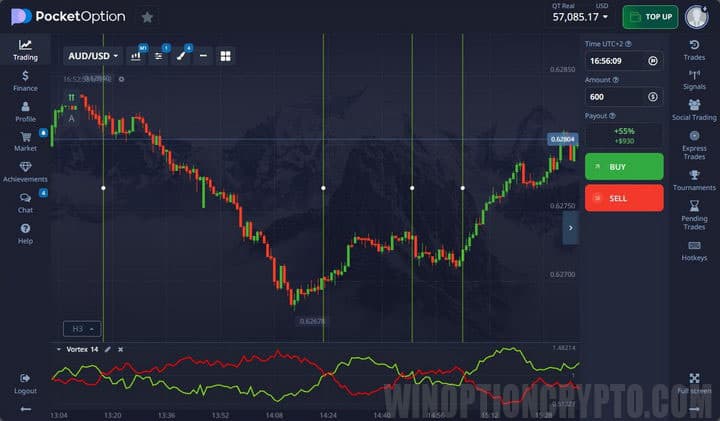
Vortex
The Vortex indicator consists of two lines, one of which reacts to upward movement, and the second to downward movement. As soon as the lines intersect, a signal appears. If the green line crosses the red line from bottom to top, then Call is bought. When green crosses red from top to bottom, Put is bought:
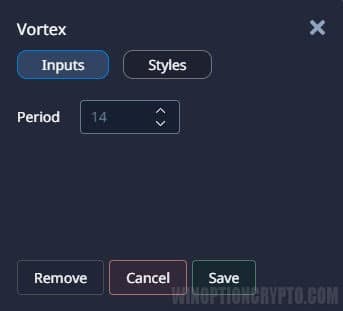
You can set the period for calculating indicator values:
Williams %R
The principle of operation of the indicator is similar to Stochastic, and it compares the maximum price and the closing price, multiplying the resulting value by “-100”. Signals for buying binary options are used when crossing overbought/oversold lines and divergences:
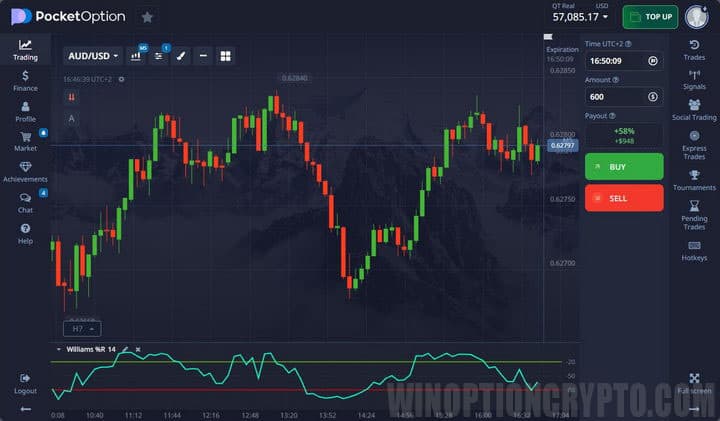
You can change the period:

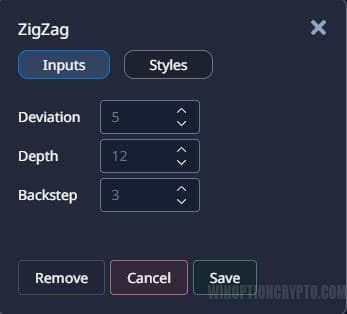
Zig Zag
A trend indicator that is not used to receive signals, but only to determine the prevailing price direction. Zig Zag connects extreme points, filtering out small fluctuations and price noise:
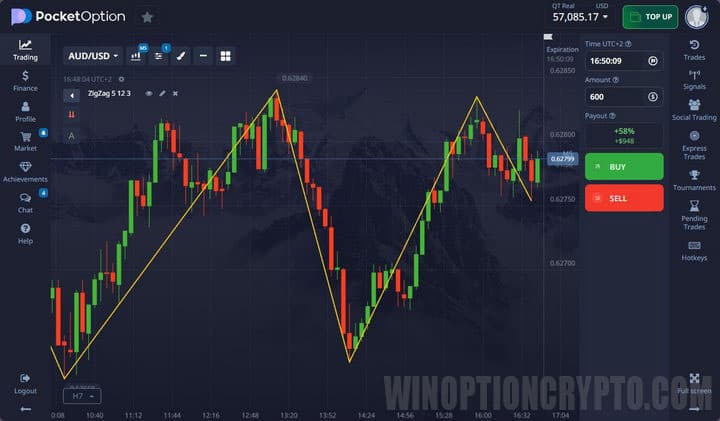
You can configure the deviation, depth for calculation and backstep:
Examples of Using Pocket Option Indicators
When setting up the selected instrument used in binary options trading, you must remember that you need to set a certain sensitivity to lag. Therefore, it is recommended to use different combinations that can give effective signals.
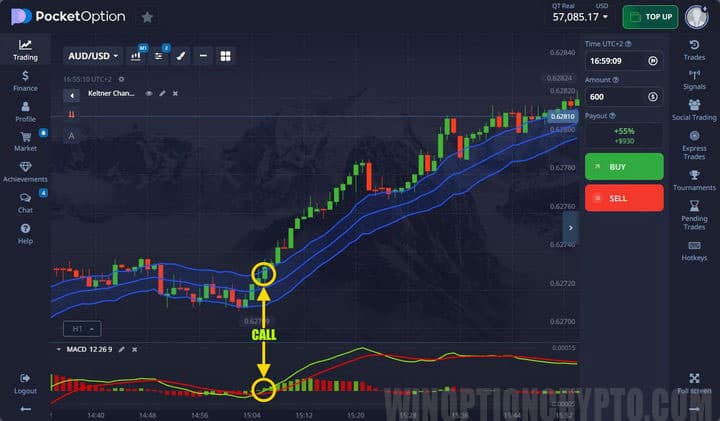
In particular, in binary options trading you can use Vortex, ADX or MACD. The latter are capable of providing effective signals taking into account the nature of price movement and volatility or trend. The control point on the graph where the graphs intersect can be displayed as a vertical line:
Trading signals received within the framework of the chosen strategy for binary options are interpreted according to the standard scheme. But it is recommended to open orders in this case, taking into account the potential probability of an expected jump in quotes.
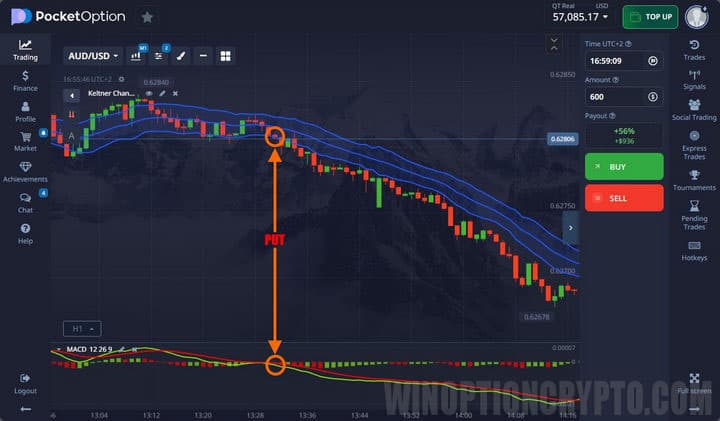
The presented screenshot shows an example of buying a Put contract in the Keltner channel indicator system in combination with a trend oscillator. The first signal appears when the price returns to the channel from bottom to top, the second gives MACD, which confirms the direction of price movement:
The following screenshot shows an example of a successful purchase of a Put contract using a similar strategy:
To successfully trade binary options, it is recommended to monitor changes in the market situation using a Forex terminal (this could be, for example, MetaTrader 4). But Pocket Option provides all the tools necessary to successfully conclude transactions. Therefore, you can trade directly through the brokerage platform, without expanding the proposed functionality through third-party developments.
START TRADING WITH POCKET OPTION

To leave a comment, you must register or log in to your account.