The ADX indicator, or, as it is also called, the directional movement index, is one of the most popular technical indicators of the Forex market. First described by J. Wells Wilder Jr. in 1978, this technology has undergone minor changes over its almost forty-year history, while maintaining its uniqueness.
The mentioned uniqueness of the indicator is expressed, first of all, in the fact that it can rightfully be called a trend oscillator, i.e. it is capable of not only signaling the direction of the trend, but also determining its potential with fairly high accuracy.
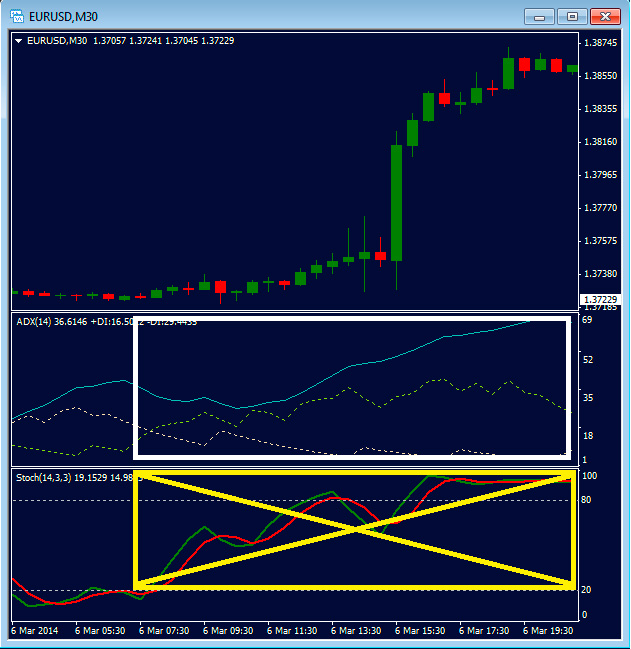
But you should immediately draw the attention of traders, especially beginners, to the fact that using this technical analysis tool as an independent and, most importantly, self-sufficient tool is very risky. Many experts tend to call this approach simply adventurous.
Description of the ADX indicator
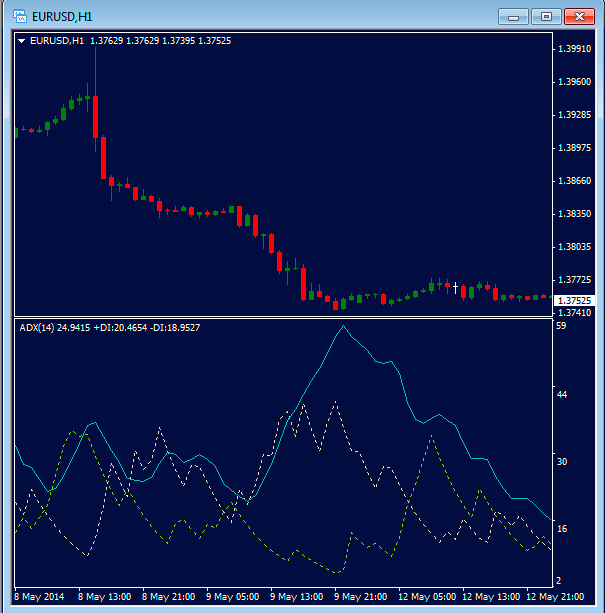
Almost all trading platforms have this indicator in their arsenal of analytical tools, but its description is not the simplest. Externally these are three lines:
- +DI - positive direction indicator;
- -DI - negative direction indicator;
- ADX indicator line (average indicator), which is calculated based on the first two.

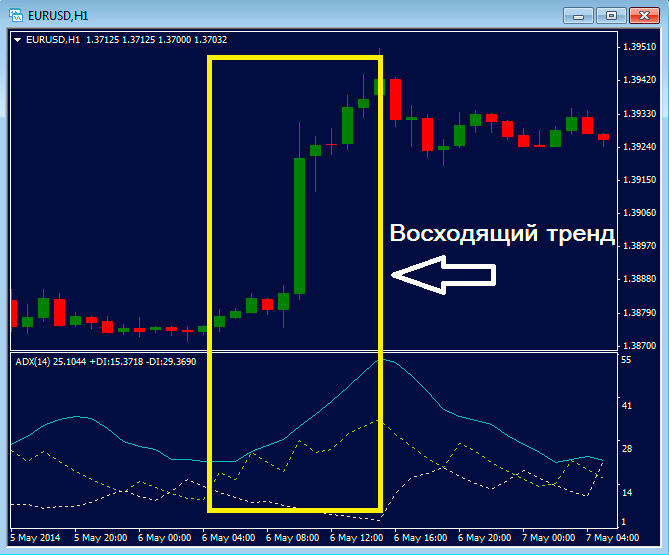
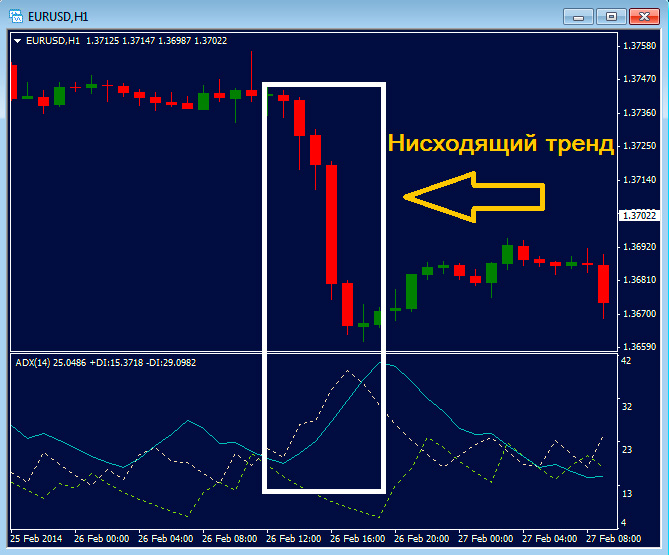
All lines move within a range limited by the levels “0” and “100”. They are all “informative”. The ADX line informs us about the presence (the indicator is directed upward) or the absence (sideways or downward movement of the indicator) of prevailing trends in the market.

The +DI and -DI lines tell us exactly what sentiments are currently prevailing in the market - if +DI is greater than -DI - the bulls “rule the show”, if less - bearish sentiments dominate the market.

The “field of activity” of the indicator is from 0 to 100, but, as practice shows, it almost never rises above the level of 60. If it is above the 40th level, then this indicates the presence of a strong trend, if below 20, then we can safely talk about no trend.
Additional confirmation of the presence of a trend is the large distance between the signal lines (DI). Accordingly, their “convergence” indicates a decrease in trend momentum.
ADX indicator settings
Instructions for installing indicators in MetaTrader 4 :
The indicator is easy to use. To figure out how to use it, a trader needs to set two parameters:
- Period;
- Price.
The price is simple. In principle, you can use any prices, but the developers recommend closing prices.
With the period the situation is somewhat more complicated. The default is 14 bars, but in the literature you can find recommendations that consider various options in the range from 7 to 30 bars.
When choosing a period, a trader must take into account the following feature of the indicator:
- Increasing the period reduces the efficiency of the indicator, i.e. the higher the period, the “smoother” the ADX moves, but there is a possibility (and it is very high) that the trader will “catch up with the departing train,” which very often has a detrimental effect on profit;
- An indicator with a short period generates a large number of false signals for binary options , which cannot “please” the trader.

conclusions
The ADX indicator is multifaceted, and it is quite difficult to describe all its features in one article. The main thing that a trader should know about the directional movement index (as well as all other technical analysis indicators) is that information from one source is not information, but just a version. And this version must be confirmed (or refuted) by information obtained from other sources (indicators).
Download the ADX indicator for free:
Can't figure out how this strategy or indicator works? Write about it in the comments to this article, and also subscribe to our YouTube channel WinOptionCrypto , where we will definitely answer all your questions in the video.


To leave a comment, you must register or log in to your account.