The Pocket Option broker's trading platform is a functional web terminal with many functions and capabilities. Because of this, novice traders may not immediately understand how to use it to its full potential, because Pocket Option allows you to customize the chart, use indicators and graphical elements, copy trades from the chart , and much more. Therefore, in this article we will look at how to configure the Pocket Option broker terminal.
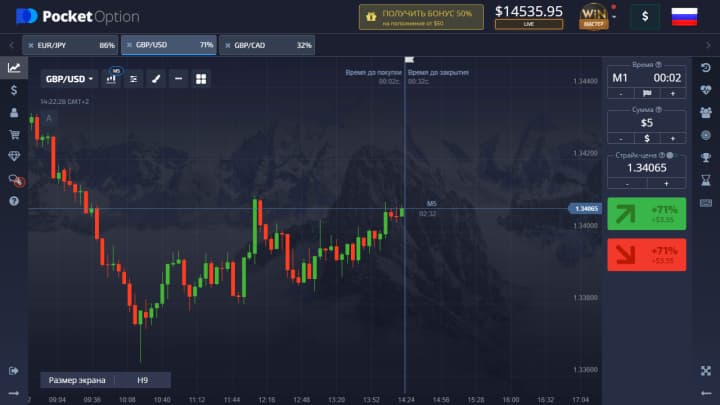
Pocket Option: working platform settings on the screen
You can make changes to the standard settings of the Pocket Option terminal through the menu, presented in the form of three dots, which are located in the same place as the section with the selection of assets:
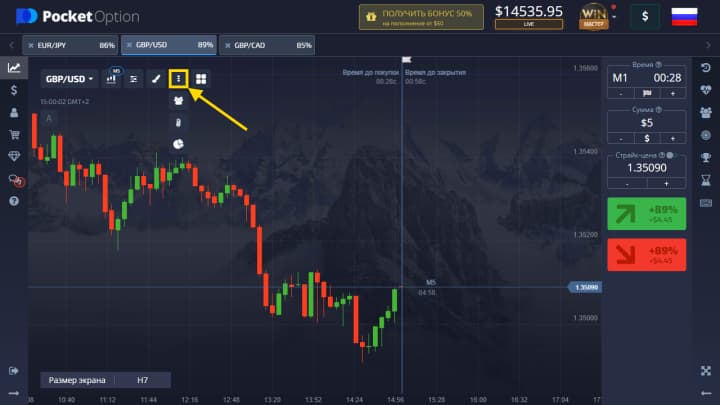
In this list you can find:
- social trading;
- market sentiment;
- monitoring of transactions.
Displaying and copying other users' trades
Pocket Option offers traders the ability to view transactions of other users. This function works in real time, and all transactions of other users are displayed on the chart. To enable or disable this option, in the settings section, click on the “Social trading” button:
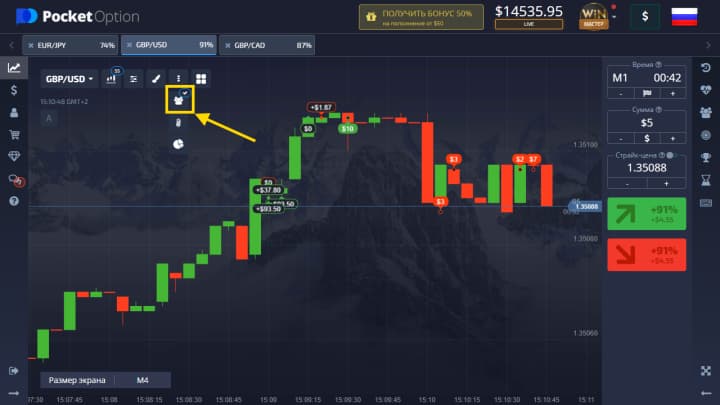
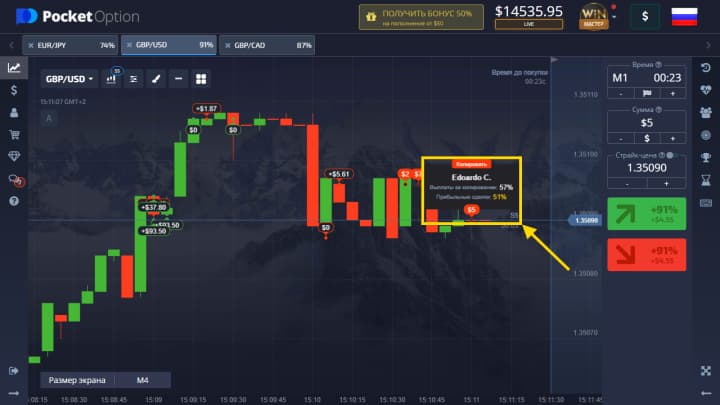
Each trader can copy trades made by other users directly from the chart. But only 10 seconds are allotted for this. When copying transactions, you need to take into account that a new order is then opened for the same amount that the other user invested in the operation. If there are insufficient funds in the account, the procedure will not be carried out. To perform such an operation, you need to select any trade on the chart and click on “Copy”:
Market sentiment
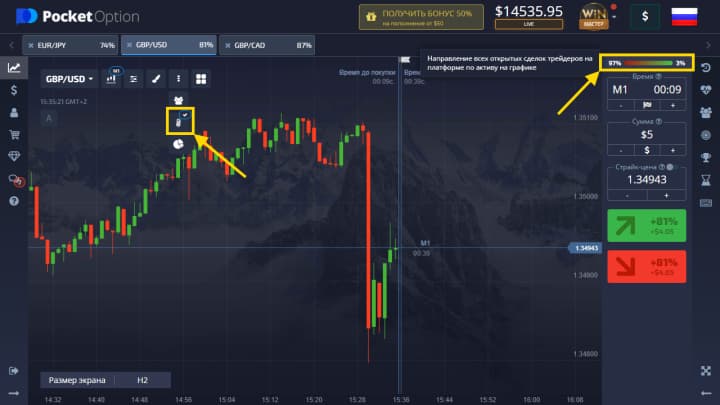
The Market Sentiment feature allows traders to monitor the trades that other users are making in real time. This option is also used to see the current ratio between the quantities of Call and Put options (green - Calls, red - Puts). Thanks to this, traders understand the mood of the market.
This function is enabled through the same section with the trading terminal settings:
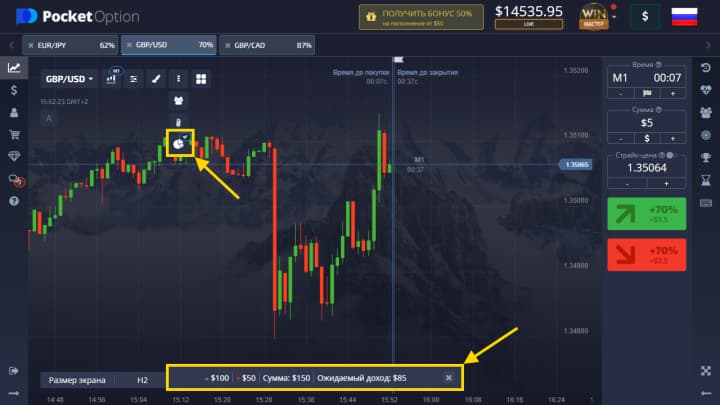
Enabling transaction monitoring
When you launch this option, a window opens that displays all open trades indicating the amount of expected profit. You can open such a monitor through the settings menu by clicking on the corresponding button:
Setting up a schedule
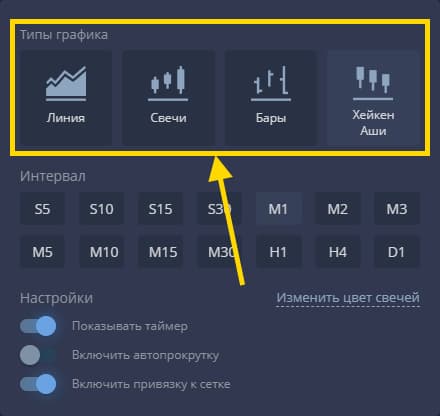
The Pocket Option platform supports 5 types of charts:
- Japanese candles;
- lines;
- region;
- bars;
- Heiken Ashi .
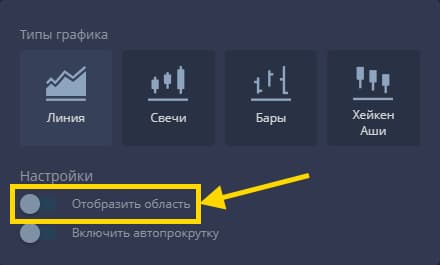
An area chart is presented in the form of a tick chart, which displays price movement in the form of filled figures. This process takes place in real time. That is, the new price appears immediately after the exchange rate changes. A tick refers to the minimum price fluctuation. If the rate changes significantly, several ticks may appear on the chart simultaneously. To enable the area, you need to select the “Line” graph, and then select “Display area” in the settings panel:
The “Line” graph visually resembles the previous one. But in this case, the price movement is displayed in the form of lines.
A candlestick chart shows the change in exchange rate as a range from minimum to maximum within a given time frame. The body of the candle is the difference between the opening and closing prices. The thin lines located above and below are shadows. This parameter shows, respectively, the maximum and minimum price values that it reached during the formation of the candle. This graph also shows the nature of the exchange rate change. If the trend is going up (the closing price is higher than the opening price), then the candles are colored green, and if the trend is going down, they are red.
A chart with bars is visually similar to a candlestick chart. In this case, the chart also displays the opening prices (shown as a horizontal line on the left), closing prices (the line is located on the right), maximum and minimum.
The Heiken Ashi chart is visually indistinguishable from a candlestick chart. But in this case, candles are formed using an algorithm that minimizes the influence of market “noise” and smoothes prices.
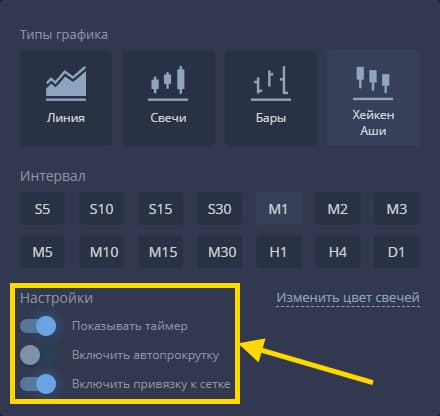
You can also enable/disable in the chart settings:
- display of a timer, which is shown next to the price;
- automatic scrolling of the chart;
- snap to the grid.
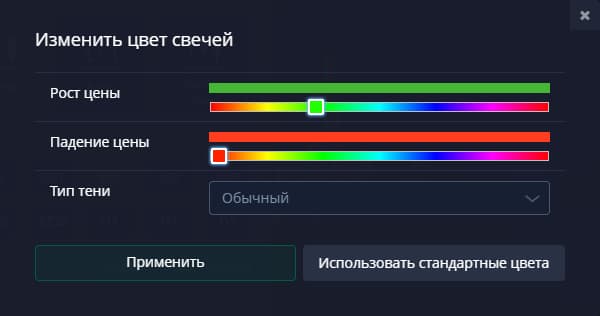
If desired, you can change the color of the candles. To do this, click on the “Change candle color” button:
Hiding balance and personal data
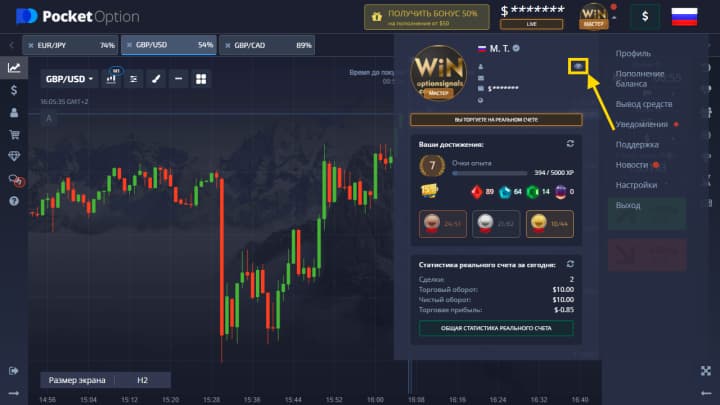
If a trader needs to hide the deposit size and personal data that are displayed on the chart, then he needs to click on the avatar and disable the “Show data” option by clicking on the “eyes” icon:
Secret Settings
Not all traders know about these settings, as they are hidden in the trading account information tab, which can be opened by clicking on your icon:
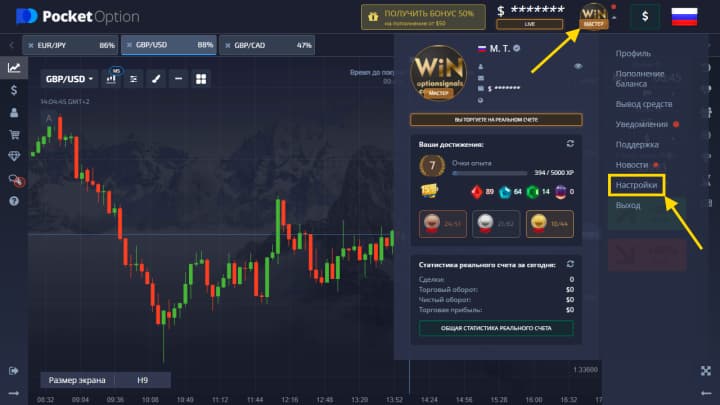
Next, a window will open with settings that can be useful to any traders.
Turn on sounds
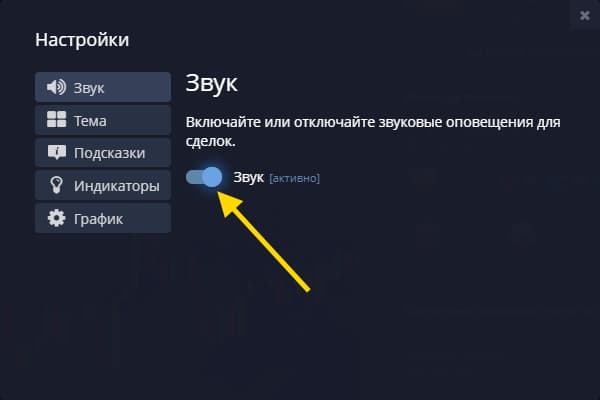
Traders don't spend all their time watching the chart and waiting for the trades they place to close. However, users need to know in a timely manner when operations are completed. For such purposes, the Pocket Option terminal provides sound notifications; to enable them, you need to run “Sound Control” in the settings section:
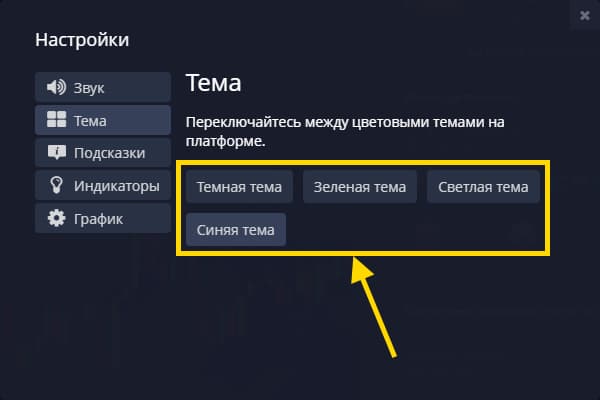
Changing the color theme
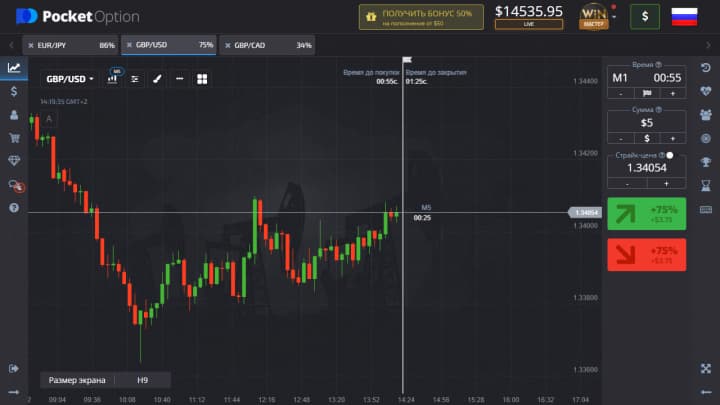
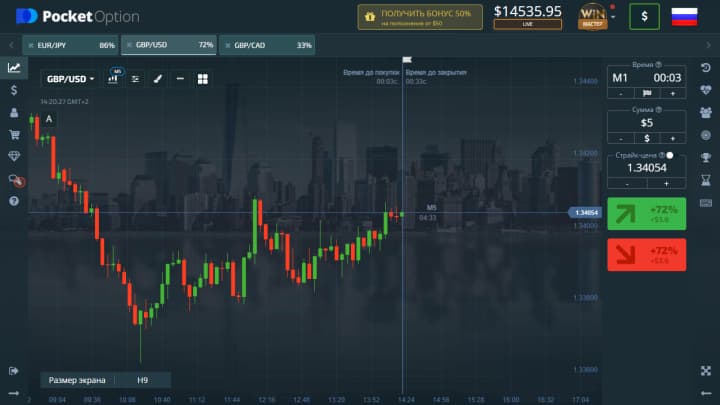
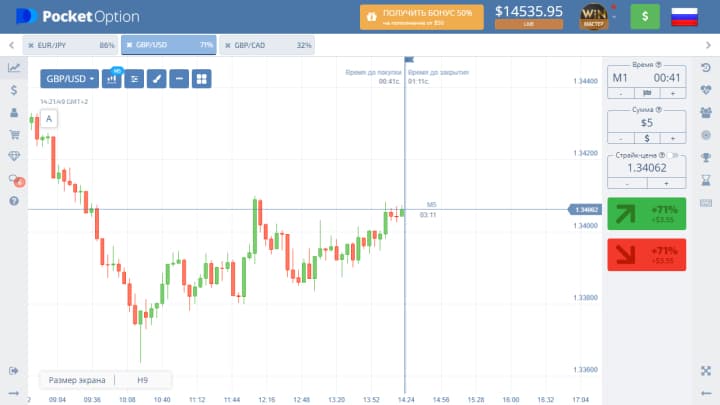
If you wish, you can change the color theme of the entire terminal, of which there are four to choose from:
- dark theme;
- green theme;
- light theme;
- blue theme.
And your terminal might look like this:
| Dark | Green |
 |
 |
| Light | Blue |
 |
 |
Hints on trading results on the chart
This notification notifies the trader about the transaction amount and the results achieved after closing the transaction, which appear on the chart:
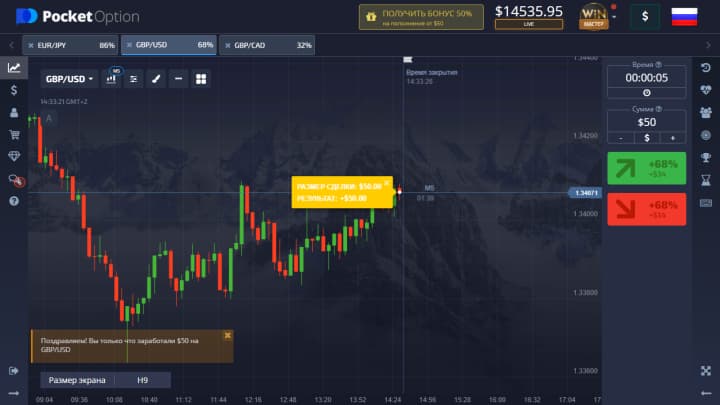
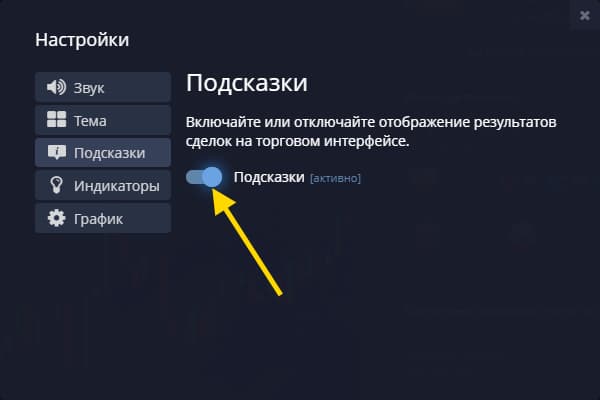
This option is turned on and off through the settings menu on the “Hints” tab:
Indicators
In this case, we are not talking about technical indicators. This menu provides access to quickly switch between the economic calendar , free signals and PocketOption bonuses :
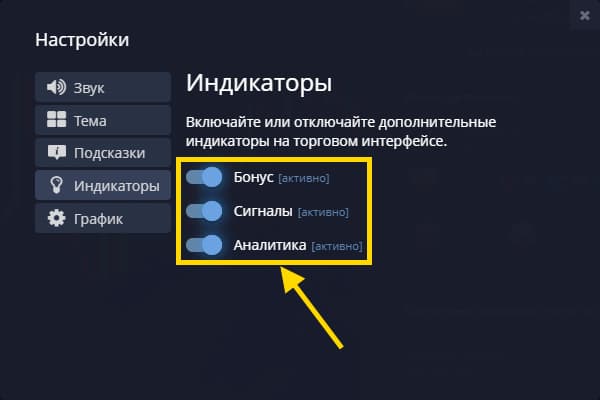
After enabling the parameters, icons of bonuses, signals and analytics will appear in the upper left corner of the chart:
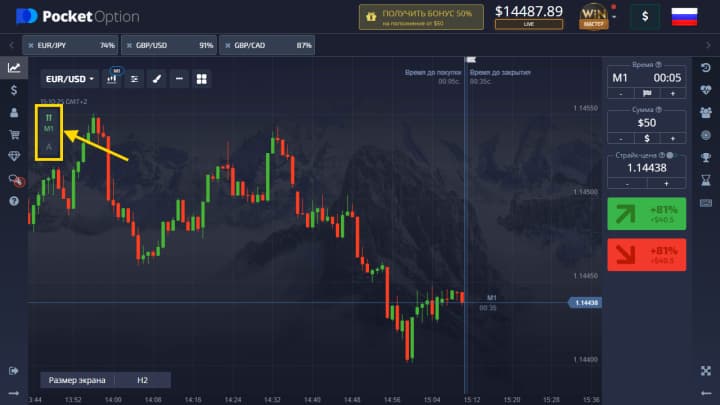
The “Signals” function (displayed as an arrow) gives traders access to information about the expected direction of price movement, which is determined based on an automatic analysis of the current market situation. This parameter can be configured for a specified time of purchase. The number of arrows determines the strength of the trend: the larger the first parameter, the higher the probability that the price will move in the indicated direction. If you click on the signals icon, you can see a recommendation for making a trade:
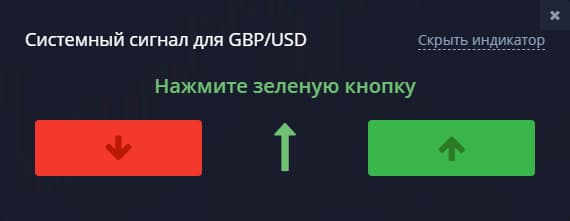
Warning: If you click on the red or green button, a trade will open!
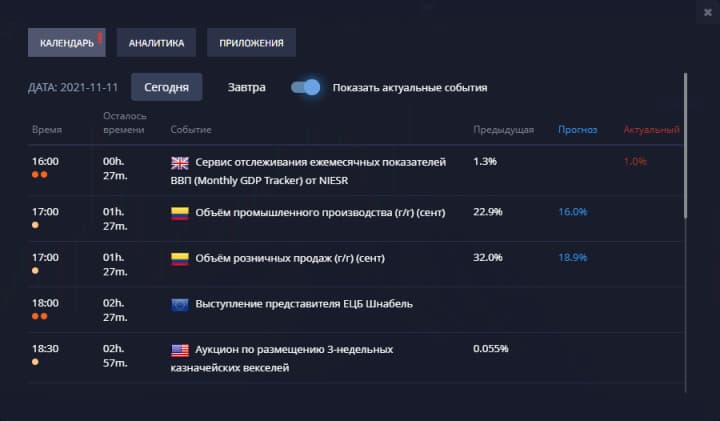
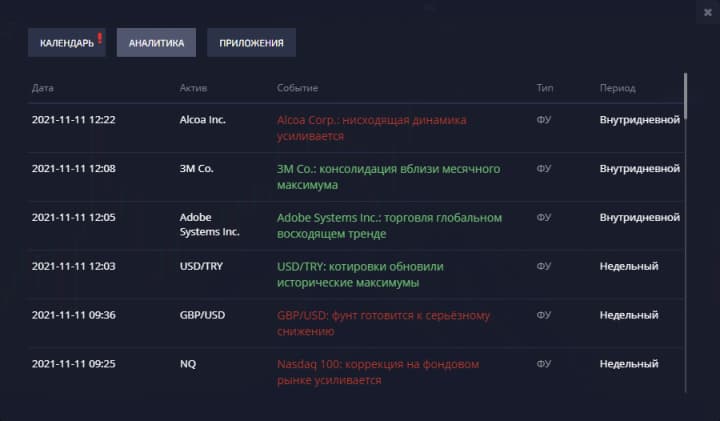
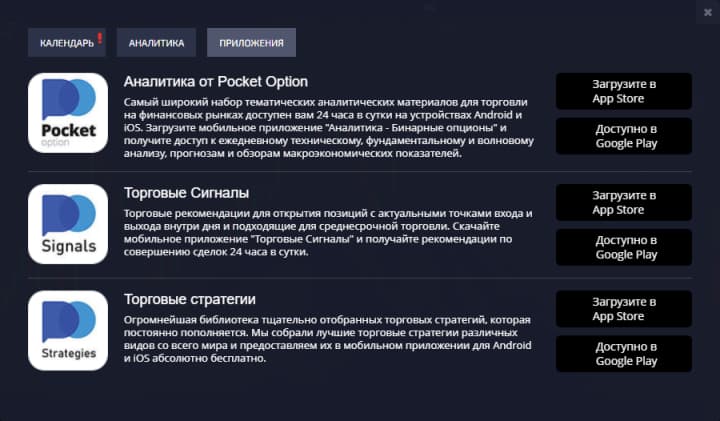
If you click on the analytics icon, a window with three tabs will open:
- economic calendar;
- analytics;
- applications.
| Economic calendar | Analytics | Applications |
 |
 |
 |
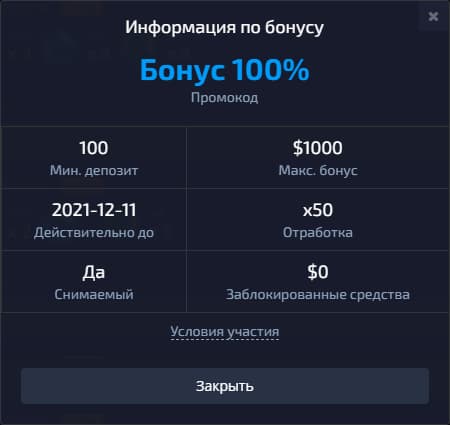
The bonus icon appears if you have a Pocket Option promotional code activated at a given time. When you click on it, information will appear about which bonus is being used. This information is displayed as a pop-up window:
There may also be icons showing active risk-free trades, boosters and the gem lottery.
Boosters are shown as a "B" and the risk-free trading feature, which is used to remove losing orders, is shown as an "R".
Gems are a unique offer for Pocket Option. Crystals give traders access to additional bonuses. Pocket Option regularly holds gem lotteries, information about which can be obtained by clicking on the “G” icon.
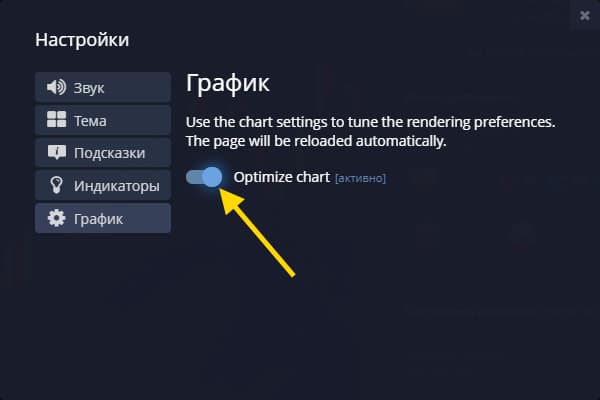
Schedule optimization
The last tab in the settings is schedule optimization, which can help speed up the schedule, but note that this may not always work:
Trading assets window
Trading assets can be found in a special window by clicking on the asset icon in the upper left corner. This window has some settings/functions and is available to traders:
- search;
- adding to favorites;
- sorting by profitability or alphabetically;
- view the schedule.
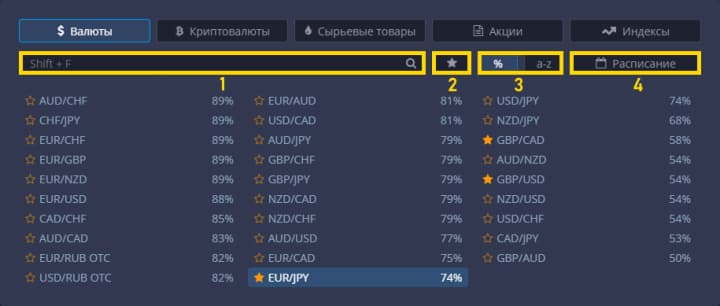
Search allows you to quickly find an asset by name.
Adding to favorites is suitable for those traders who use the same assets in trading. Therefore, it will be convenient to mark them with a “star” so as not to waste time searching for them every time.
Sorting by profitability or name will show you the most profitable instruments first or sort assets alphabetically.
The schedule allows you to see which assets are currently being traded, which are closed, and which quotes are provided in OTC format:
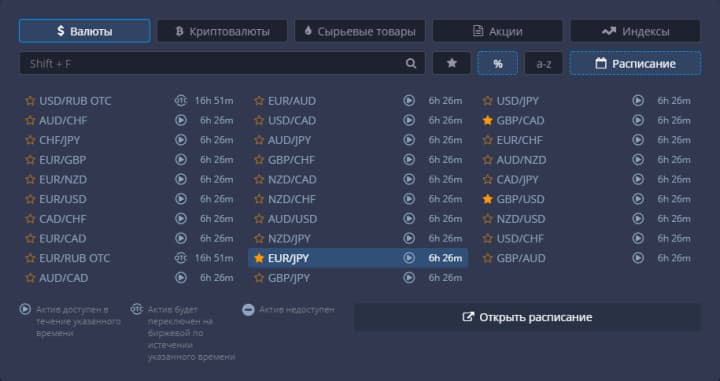
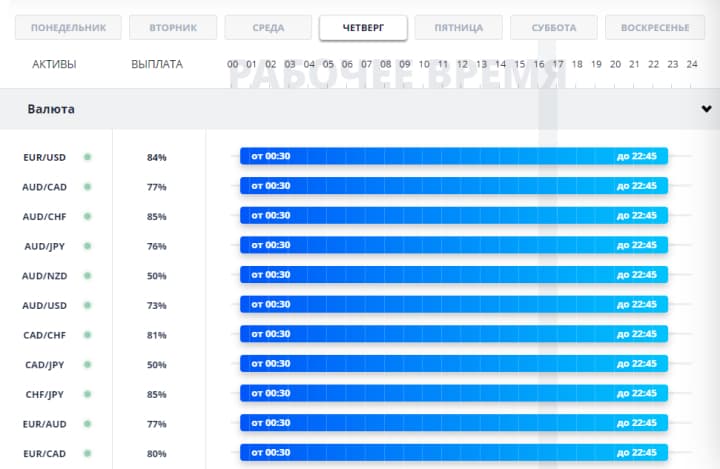
If you click on the “Open schedule” button, you will be able to view the schedule for all trading instruments of the Pocket Option broker:
Multigraph
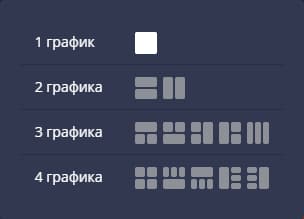
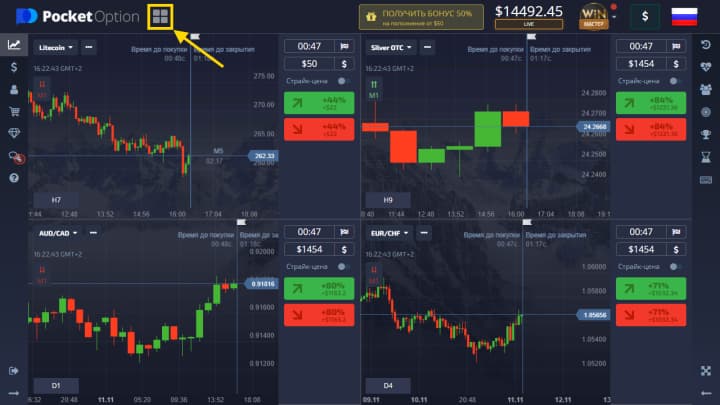
If you want to monitor several charts at once, you can use the “multi-graphics” function, which allows you to open up to 4 windows simultaneously in different ways:
By choosing a standard arrangement in the form of four uniform windows, you can get a convenient display:
Hotkeys
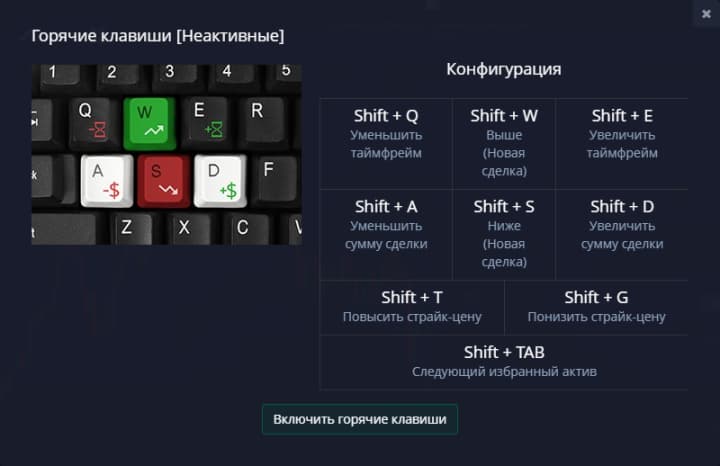
There is a “keyboard” icon on the toolbar on the right. By clicking on it, you can open the hotkey settings.
Hotkeys are more relevant for experienced traders who make many trades and decide to open orders within a few seconds. In this section, users can independently determine the exact task for each key depending on personal preferences.
Conclusion
The Pocket Option broker has a large number of settings that can simplify trading in a technical sense. Please note that it would be more correct to study all the settings you need on a demo account , since some parameters affect trading and are best tested with virtual money.
Open an account with PocketOption


To leave a comment, you must register or log in to your account.