Moving Averages are one of the very first indicators used by traders all over the world and are suitable for absolutely any market, including binary options , since it is based on an average price.
In addition, this indicator is the simplest and most understandable and is used in many strategies , but despite this, there are some details that we will delve into in order to thoroughly study the algorithm of the indicator.
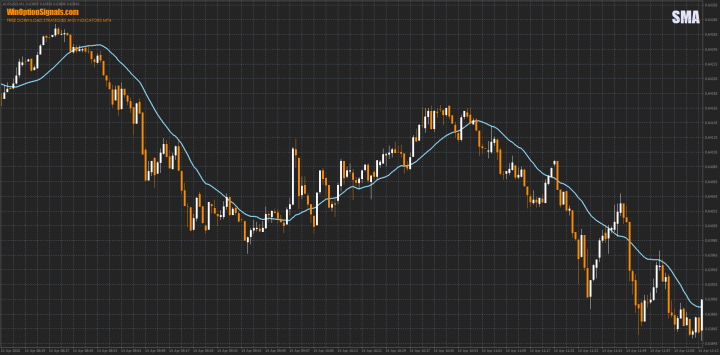
Types of Moving Average indicator
The Moving Average indicator is not as simple as it seems and it has different types of calculation algorithms:
- SMA (Simple Moving Average).
- EMA (Exponential Moving Average).
- LWMA (Linear Weighted Moving Average).
- SSMA (Smoothed Moving Average).
All these modifications have their pros and cons, but it makes no sense to use them all in binary options trading, since they work in a similar way. Therefore, we will consider the most popular and most often used modification by traders - SMA.
Adding the SMA indicator to the chart
The Moving Average indicator is present in any terminal and on almost every trading platform. One option for monitoring the indicator is a live chart for binary options . The second and most convenient option is to use the MetaTrader 4 terminal.
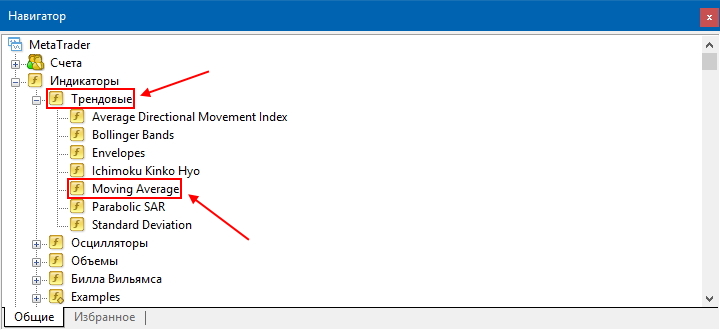
To add an indicator to the chart, you need to select the trend indicators section in the “Navigator”, where you can find “Moving Average”:
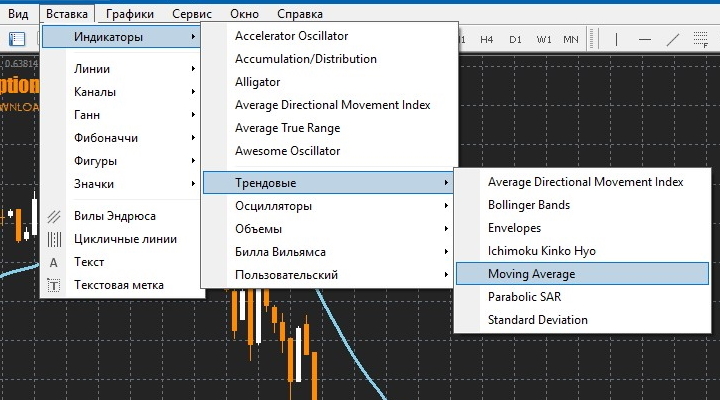
You can also add an indicator using the top menu bar:
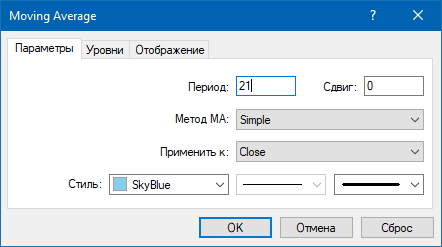
In the indicator settings menu that opens, you can configure:
- Period. The period is the number of bars that will be taken to calculate the indicator line.
- Shift. This parameter is visual.
- Method. Since SMA is being considered, the method should be chosen “Simple”.
- Application to prices. The best option is always "Close" (closing prices).
- Style. This parameter is visual.
Instructions for installing indicators in MetaTrader 4:
How are SMA indicator indicators calculated?
Now that there are many terminals, all calculations are done automatically, although previously traders had to do everything manually. But the calculations of the indicator are quite simple. Let's consider them using the example of a moving average period equal to “3”. The specified period takes into account closing prices and then calculates the average. If we have prices of 100, 150 and 180, adding them up we get 430 and dividing this by 3 (period), the indicator value comes out to 143.33. Exactly the same algorithm will be used for periods of 5, 10, 20, and so on.
Why can you use the SMA indicator in binary options trading?
The SMA indicator can be used in different ways. The most popular options are:
- Determining the trend.
- Definition of momentum.
- Determining support/resistance levels.
Now let's look at each of the options in more detail.
Determining the trend using the SMA indicator
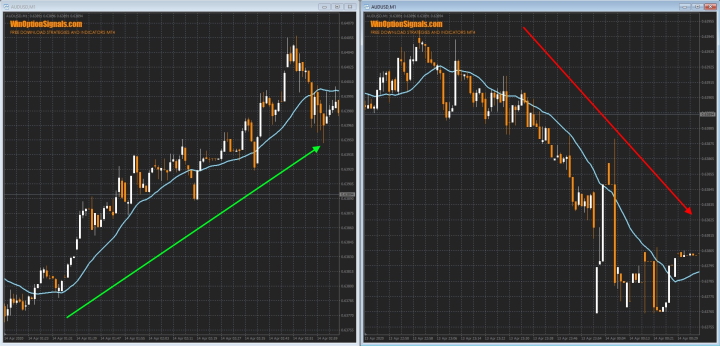
Determining the trend using a simple moving average is very easy. When the trend is upward, prices are above the SMA indicator and even when the line is broken, they do not stay below it for long. When the trend is downward, prices are below the SMA indicator and almost do not cross the line from bottom to top:
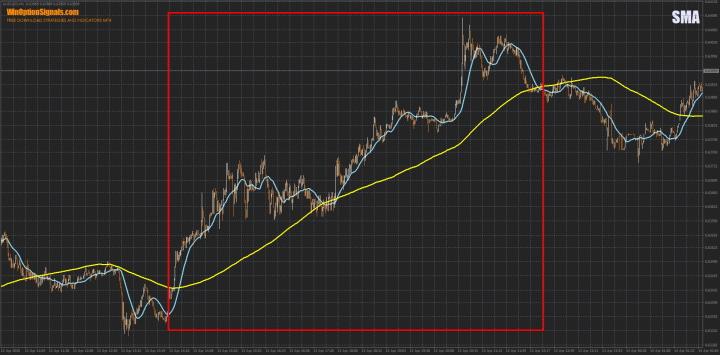
In this case, the period “21” was used. But the higher the period of the average, the better it will show the trend, since there will be almost no false breakouts. Here is an example with two different periods:
The marked area shows how the 21-period average shows only a local trend, while the 200-period average (yellow) shows the general trend.
Determining Momentum Using the SMA Indicator
To put it simply, momentum is a signal that a trend is ending or, on the contrary, beginning. This method shows the rate of change in price movement.
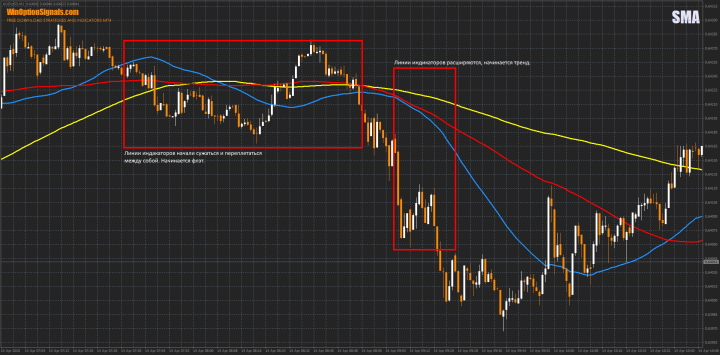
In order to determine the momentum of price movement, you will need to use three SMAs with periods of “50”, “100” and “200”:
If the moving averages begin to intertwine, the trend is most likely over and a flat begins. But as soon as the lines move away from each other, a trend begins.
Determining support and resistance levels using the SMA indicator
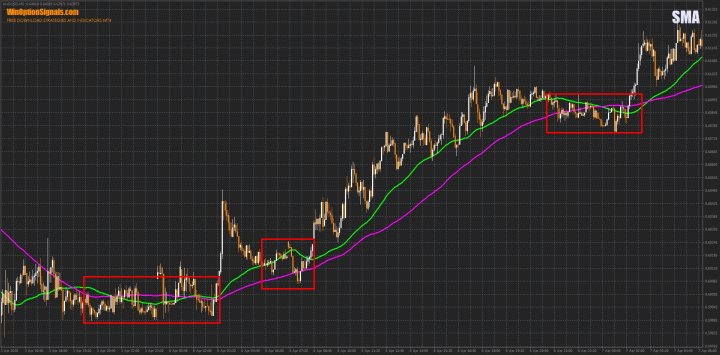
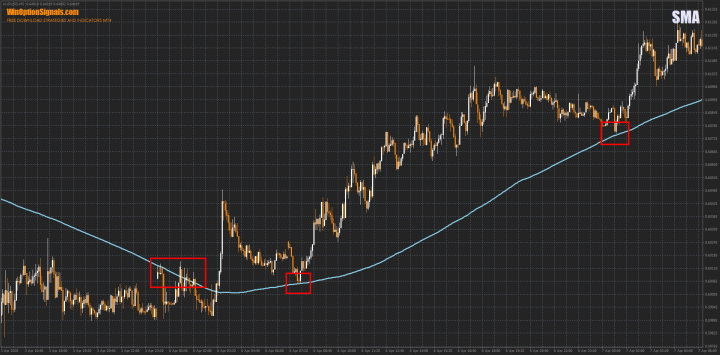
The SMA binary options indicator can be a good way to determine support and resistance levels, but it’s worth noting right away that any period less than “200” will not be suitable for this:
In the chart above, the periods “50” and “100” were used, and as you can see, despite the fact that there are good rebounds, there are many times more breakouts in different directions.
And now the same section, but with an SMA period equal to “200”:
The price bounces off the levels well, and when the price breaks through the indicator, the resistance already becomes support.
Please note that there is no point in looking for strong trend movements on charts smaller than M5.
Conclusion
As it becomes clear, the Simple Moving Average indicator can be used both in binary options and Forex trading. This indicator helps to determine the trend and flat, and also gives possible support and resistance levels that are known in advance.
Do not forget that the best option for testing any indicator or strategy for binary options is trading on a demo account. This will allow you not to lose funds if mistakes are made during trading. You can find a broker with a demo account in our rating of binary options brokers .
Download SMA indicator template
Can't figure out how this strategy or indicator works? Write about it in the comments to this article, and also subscribe to our YouTube channel WinOptionCrypto , where we will definitely answer all your questions in the video.
See also:
How to make money on the Internet during the crisis of 2020



To leave a comment, you must register or log in to your account.