
The Ichimoku strategy for binary options is based on the indicator of the same name, which is unique due to its operating algorithm. The Ichimoku indicator is a tool for tracking price movements, which, in accordance with several parameters, allows you to increase the accuracy of forecasting when working with a trend . In relation to binary options (BO), when working with this indicator, it is possible to achieve high results if its signals are used correctly.
The Ichimoku trading indicator (Ichimoku Kinko Hyo) is a comprehensive market analysis tool proposed by Japanese analyst Goichi Hosoda. The author suggested using the Ichimoku cloud indicator for:
- simplifying the use of candlestick analysis ;
- identifying a bullish or bearish trend in the market ;
- searching for support and resistance zones;
- searching for signals for making trade transactions.
The Ichimoku indicator as the basis of a trading system is a popular tool even today. Its time-proven effectiveness, ease of use in analyzing market movements and accurate signals are used by traders to develop modern trading systems. Indicator calculations help improve the performance of any trader and therefore help to capture more profits by focusing solely on market trends.
Ichimoku indicator: setup in MT4 and principle of operation
The indicator is basic and is located in the MetaTrader 4 terminal , so you do not need to install it there. To work with it, you just need to add it to the chart / It is located on the “Insert” tab, after which we go to “Indicators”, then to “Trend” and select the Ichimoku Kinko Hyo indicator:
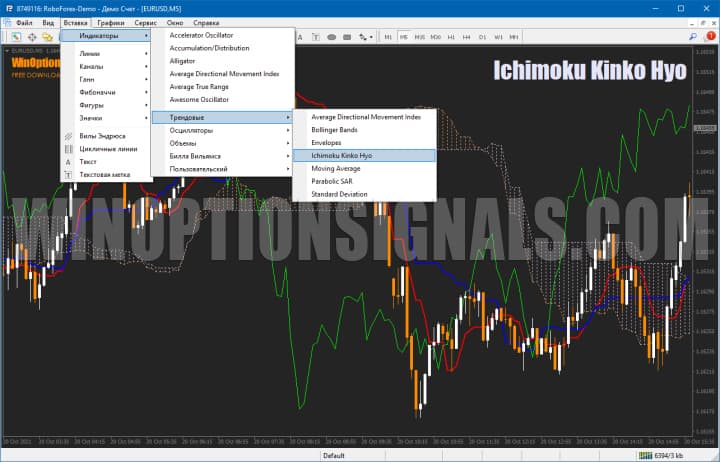
The indicator settings can be left as default.
This indicator is a trend indicator , therefore it perfectly determines the direction of the market, as well as its strength and weakness. Thanks to a whole set of indicator signals, it is much easier for a trader to read the market, determining:
- price direction;
- end of price correction;
- completion of impulse;
- transition to the accumulation stage.
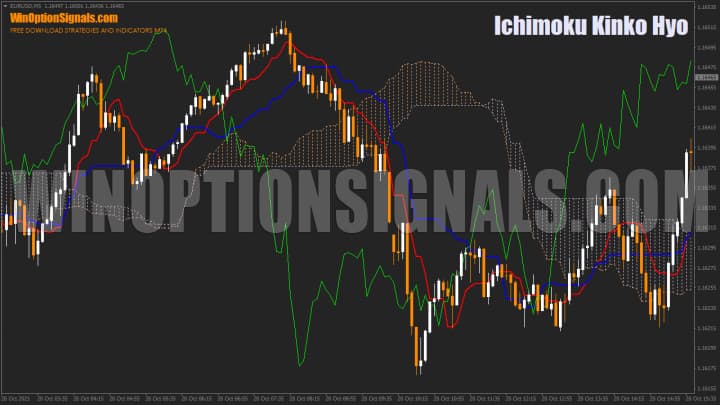
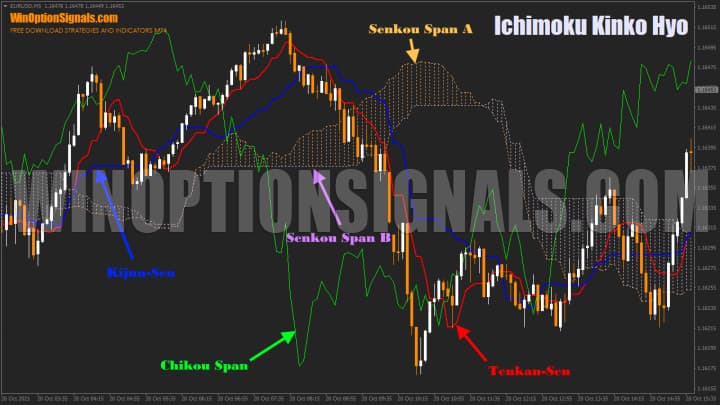
The Ichimoku trading indicator presents 5 lines on the chart:
- the Tenkan-Sen reversal line is a moving average of the median price with a period of “9”;
- the Kijun-Sen standard line is a moving average of the median price with a period of “26”;
- Chikou Span (Chikou Span) is a line shifted back, displaying the line of quotes at closed prices;
- Senkou Span A (Senko Spa A) and Senkou Span B (Senko Spa B), also known as Kumo, use in their calculations the average parameter from Tenkan-sen (Tenka-se) and Kijun-sen (Kujun-se), shifted to "26 " and "52" periods.
How to use the Ichimoku Kinko Hyo indicator
After adding the Ichimoku Cloud indicator to the chart, you can see how it generates a large number of signals, which in order of importance (from weak to strong) can be divided as follows:
- calculations of the Tenkan-Sen line (Tenka-se) in red;
- calculations of the Kijun-Sen line (Kujun-se) in blue;
- Chikou Span (Chikou-se) slow line signals are green;
- price position relative to the Ichimoku cloud Senkou Span A (Senko Spa A) and Senkou Span B (Senko Spa B).
The Tenkan- S en (Tenka-se) line forms an understanding of the current market sentiment, which will help you understand what you should pay attention to:
- the direction of this line will show the dominance of bulls or bears in the short term, and if it is directed upwards, then it is worth considering Call options, and if downward, Put options;
- the horizontal position of this line informs about the equal strength of all market participants (indicates a flat );
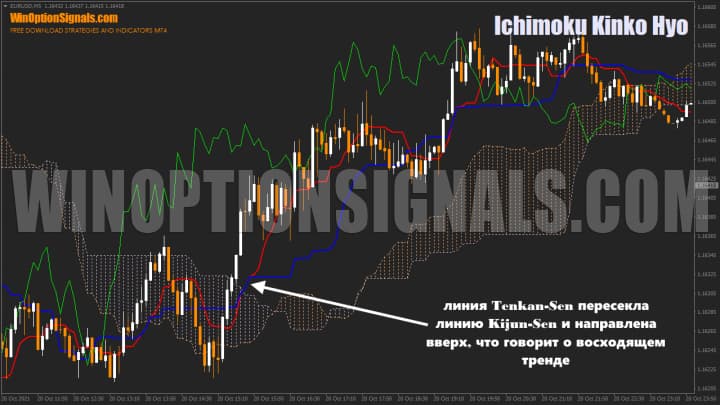
- if the Tenkan-Sen (Tenka-se) line crosses the Kijun-Sen (Kujun-se) line from bottom to top, then this indicates the victory of the bulls and acts as a signal for the Call option. If it crosses from top to bottom, then only Put options should be considered.
Despite its informative content, the Tenkan-en line is more often used as a short-term indicator, while being a weak signal for concluding binary options transactions:
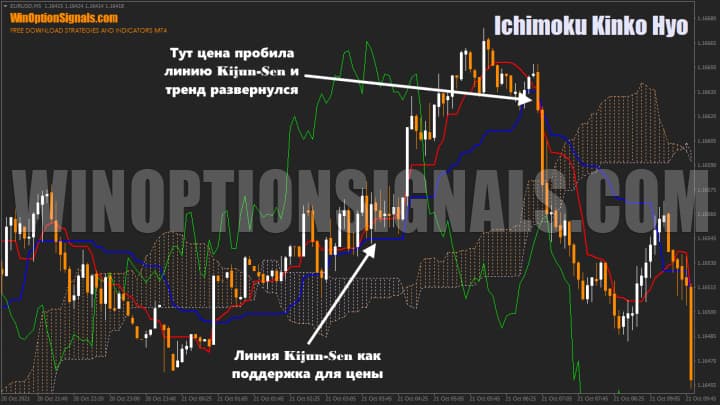
The Kijun- S en (Kujun-se) line acts as support for price movement. This line seems to “protect” the main price movement, and if the price breaks through the Kijun-Sen line (Kujun-se), then such a situation can be regarded as a strong signal of a change in market direction. A price rebound from the Kijun-Sen (Kujun-se) level will be an excellent option for “topping up,” that is, concluding an additional transaction in the direction of an established price movement:
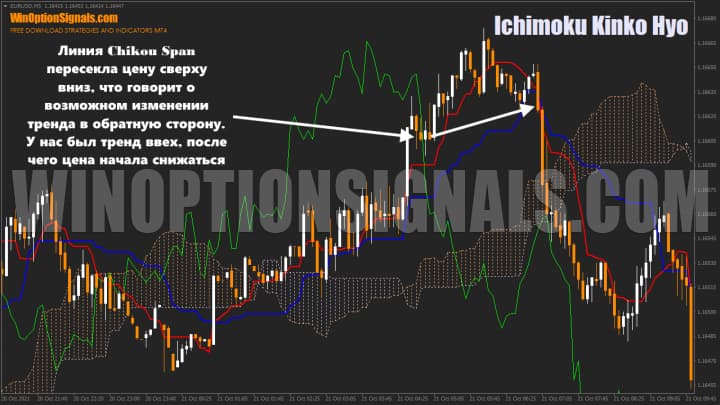
The Chikou Span line acts as a leading indicator that warns of future price changes. For analysis, you can use the situation when this line crosses the price. If a crossover occurs from top to bottom, this may mean accumulation before a downward trend, and a crossover from bottom to top indicates possible changes in the market, where an upward movement is emerging:
The Senkou Span A and Senkou Span B lines are the main secret of the Ichimoku Kinko Hyo indicator, which is used by successful traders. These lines are also called Kumo or, more simply, a cloud. Technically, this is the distance between the Senkou Span A and Senkou Span B lines, and visually it is the shaded areas on the graph.
The Ichimoku cloud can also be used in analysis where:
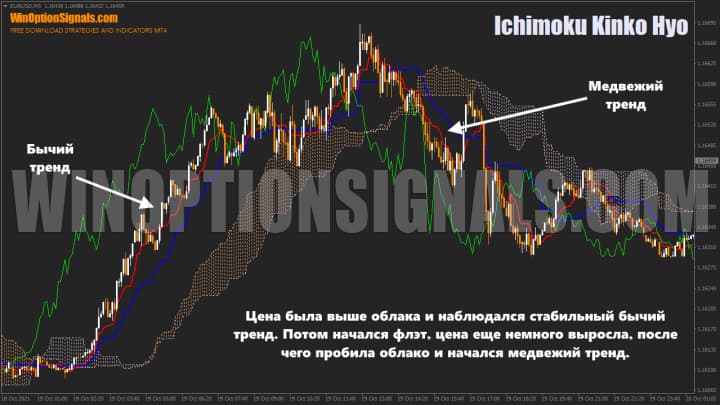
- price growth above the cloud means a stable bullish trend;
- the price position below the cloud means a stable bearish trend;
- price staying in the buffer between the Senkou Span A and Senkou Span B lines signals a weak market where flats predominate.
Ichimoku indicator: recommendations before starting trading
In binary options trading, the Ichimoku Cloud indicator is often used to identify strong support and resistance levels. The first (Senkou Span A) and second (Senkou Span B) lines of the cloud act as a hard limiter for the correlated price movement.
The Ichimoku indicator generates fairly accurate signals if the trader understands how to work with the trend. Often this indicator is used as the main or even the only tool in a trading plan, because its calculations are effective at all phases of the trend .
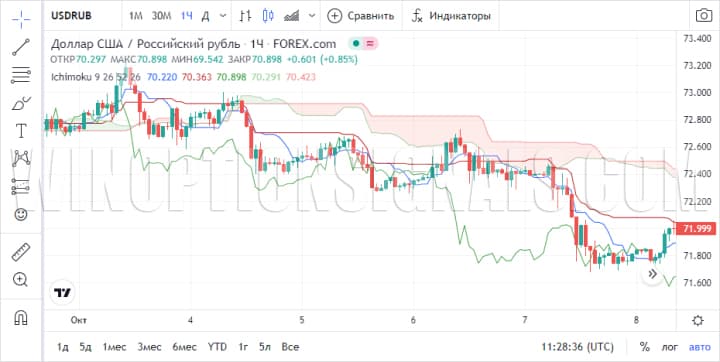
To operate the Ichimoku Kinko Hyo indicator, you can use the MetaTrader4 terminal, the TradingView platform , the terminal of your binary options broker, or the live chart for binary options on our website:
Today this indicator is available almost everywhere. Binary options brokers that definitely have the Ichimoku Kinko Hyo indicator are Pocket Option and Quotex .
Having studied the information above in detail, you most likely already roughly understand how to use the Ichimoku indicator in a strategy for binary options . If you have not yet fully understood the principles of its operation, we recommend that you study the operation of the indicator on history before reading further. This way you can compare the indicator’s performance in real time with similar examples below.
Next, we will look at several examples where the Ichimoku indicator as the basis of a trading system will be used in binary options trading using examples from the MetaTrader 4 terminal and on the binary options trading platform of the Pocket Option broker.
Ichimoku indicator: how to use in binary options trading
Let's look at general recommendations for trading using the Ichimoku indicator, after which we will move on to specific strategies and transactions.
Using the Ichimoku Kinko Hyo indicator, zones are created that are support or resistance. These zones are formed thanks to the Tenkan-Sen and Kijun-Sen lines.
If the price is in the cloud, then this indicates a flat. During the absence of a trend, it is recommended not to open trades, since at this time it is difficult to predict where the price will go next.
A breakout of the cloud indicates that the trend has changed direction. In this case, it is worth considering buying options in the direction of the breakout.

Ichimoku indicator: strategy on the Pocket Option broker platform
Ichimoku Kinko Hyo is a strategy indicator, including for trading on short-term time intervals. Even though the author of the indicator recommended using indicator signals on medium-term timeframes , modern traders have adapted its calculations for intraday trading on short-term M1 and M5 charts.
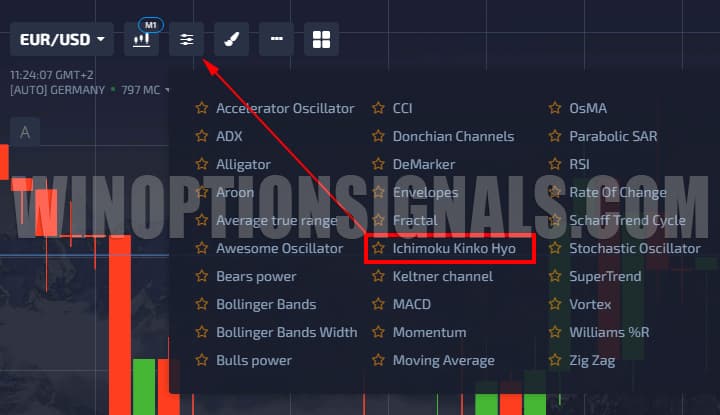
The Ichimoku strategy will be reviewed on the platform of the binary options broker Pocket Option. On the broker's platform, select the Ichimoku Kinko Hyo indicator from the indicator panel and place it on the working chart:
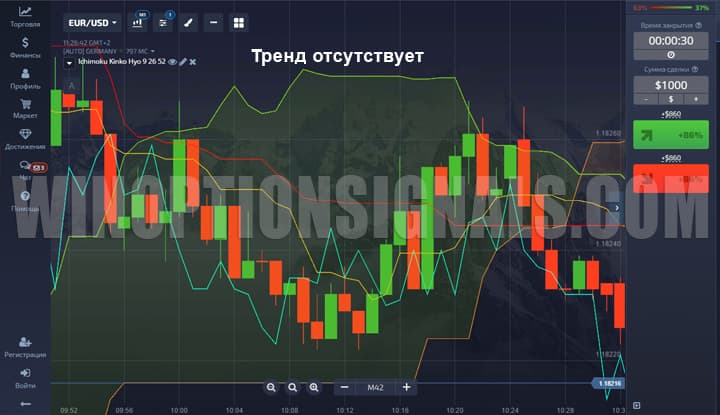
When working with Ichimoku indicator data, primary attention should be paid to the position of quotes relative to the Ichimoku cloud. If the price is distributed within the cloud, then this is an indicator of the presence of a flat:
If the price breaks through the levels of the Ichimoku cloud, then this is a strong signal of the emergence of a new trend, which should be confirmed by the intersection of the Tenkan-Sen (Tenka-se) and Kijun-Sen (Kujun-se) lines.
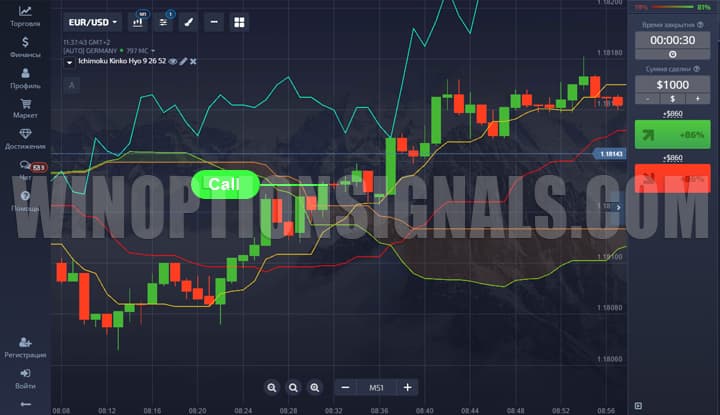
Signals to buy a Call option (Above):
- the fast line crosses the slow line below the Ichimoku cloud;
- the control candle closes above the cloud.
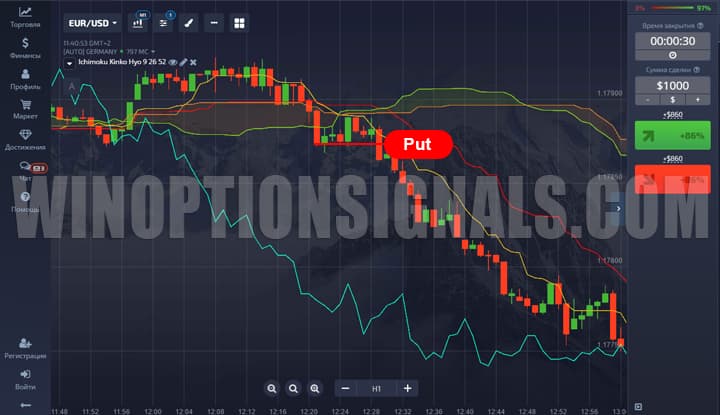
Signals to buy a Put option (Below):
- the fast line crosses the slow one above the Ichimoku cloud;
- the control candle closes below the cloud.
The determining factor is the closing of the quote above or below the cloud level. Otherwise, the signals are either rejected or interpreted as market weakness, where it would be better to play in the opposite direction.
The expiration time of options is allowed within 5-10 candles, but no more than 10 minutes for the M1 time frame, and no more than 50 minutes for the M5 time frame. Using these rules and trading with the trend, you can achieve a stable result, where the profitability of completed transactions will be up to 60% and higher. But even despite the effectiveness of the strategy, you always need to correctly distribute risks, where the maximum bet volume is limited to 5% of the trading deposit.
Ichimoku indicator and candlestick analysis
Let's look at several examples of candlestick analysis of binary options in combination with the work of the Ichimoku indicator.
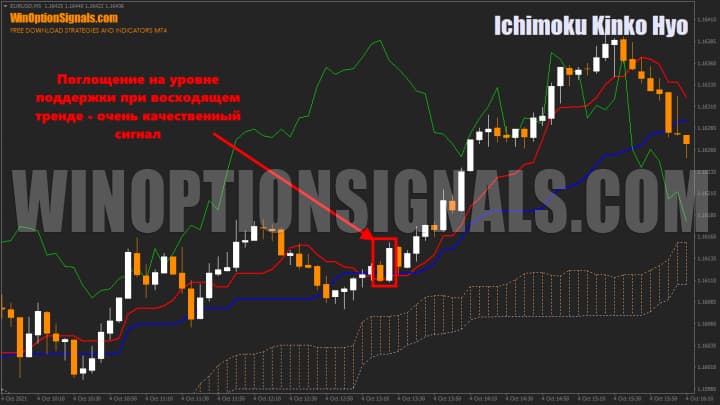
The Absorption pattern is the most popular figure in candlestick analysis. It appears when a new candle exceeds the previous one in the size of its “body”, as if “absorbing” it. This pattern is a strong price reversal signal, and by applying it at support/resistance levels from the Ichimoku indicator lines, you can receive good signals for buying options:
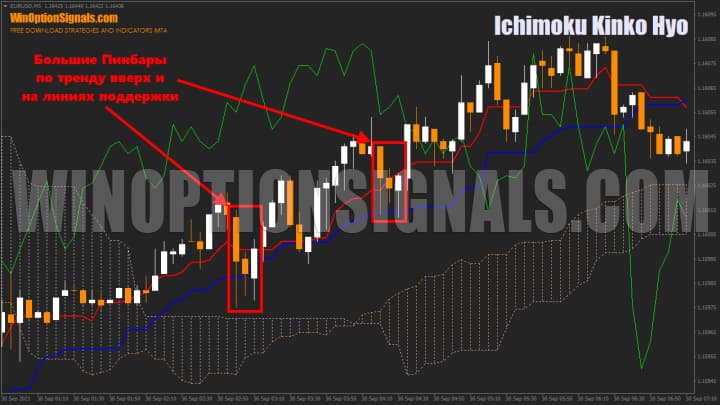
Candles with a long shadow (Pinbars) are another, no less powerful pattern in the analysis of Japanese candles. A long shadow usually indicates the strength of market participants, and if it:
- above the candle – bears dominate;
- under the candle – bulls dominate.
Enter the market if you see this signal near the support and resistance levels of the Ichimoku indicator. Such signals will also have good accuracy:
Candlestick analysis is not limited to these examples. In addition to the Ichimoku indicator, you can use any configuration of candlestick patterns, and you can also enhance your analysis using Price Action and graphical analysis .
Conclusion
The Ichimoku indicator as the basis of a trading system is an excellent choice for traders who are ready to use indicators in binary options trading, thereby simplifying technical analysis . The Ichimoku Cloud indicator differs from other indicators in functionality and is worth learning to expand your binary options trading skills.
We recommend testing all new strategies and indicators for binary options without the risk of losing your main deposit. To do this, you should first of all check their work on a demo account , and be sure to adhere to the rules of money management and risk management . This will allow you to always remain in profit, even if there are a series of losing trades. Just a few simple rules will significantly reduce risks and reduce the likelihood of losing your deposit .
Also, if you have not yet decided on the choice of broker, then on the page with the rating of the best binary options brokers there is a current rating of the leaders of brokerage services in Russia and the CIS, from which you can select a company for trading.
Ichimoku indicator free download
DOWNLOAD
Can't figure out how this strategy or indicator works? Write about it in the comments to this article, and also subscribe to our YouTube channel WinOptionCrypto , where we will definitely answer all your questions in the video.

To leave a comment, you must register or log in to your account.