CCI has been used for several years to predict price movements in financial markets. Recently, this oscillator began to be used in binary options trading. The CCI displays the commodity channel index. That is, this indicator for binary options helps to determine the points at which the price turns in the opposite direction.
Features of CCI in relation to binary options
The financial market is characterized by a change in the direction of price movement: growth, fall and flat (the chart moves sideways). The classic trading option involves placing orders in the direction in which the current trend is directed (for example, a buy deal is opened when the trend moves up). The earlier a trader enters the market in such situations, the greater the potential profit will be, provided that the position is closed in a timely manner.
The main difficulty of trading in financial markets is that it is almost impossible to predict the moments (points) of the beginning of the next trend and its completion. Indicators partially help with this, but technical tools do not always provide accurate forecasts. However, oscillators provide some benefits. Among the tools that can identify trend reversal points is CCI.
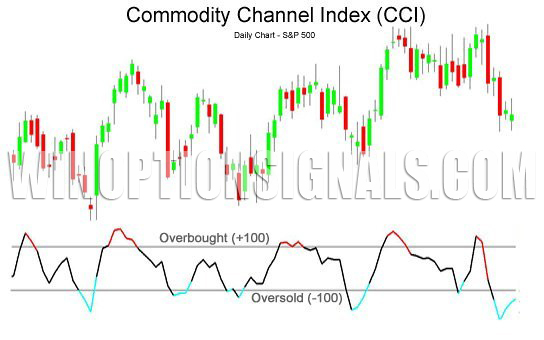
The above picture shows that the oscillator line is moving between the -100 and +100 levels (oversold and overbought levels respectively). It stays in this range up to 75% of the time. The main adjustable parameter of the CCI oscillator indicator is the number of settlement periods. The developer of the CCI binary options indicator, D. Lambert, recommends defining this value as 1/3 of the market cycle. That is, if a trader needs an analysis carried out over the last month, then this parameter should be equal to 10 days.
The developer also noted that if the permissible values are exceeded (for example, instead of 10 days, set 13), the oscillator will begin to give fewer trading signals. If this indicator decreases, the number of incorrect forecasts will increase. These are general recommendations, intended mainly for beginners in binary options trading.
An example of how the CCI indicator works
As an example of how the indicator works, we will consider signals issued for the USD/CAD currency pair.
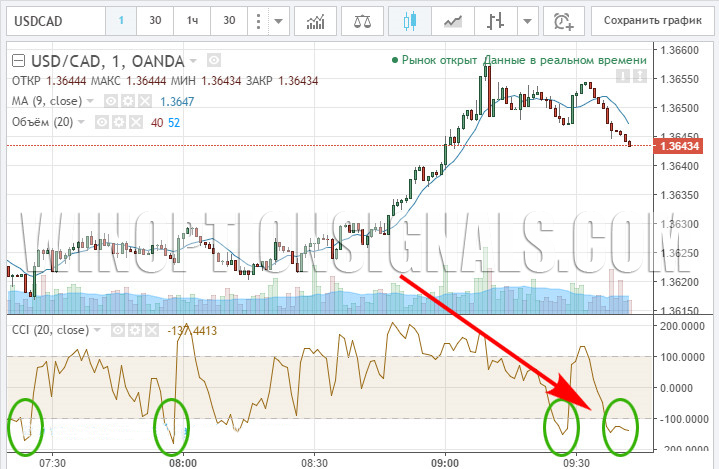
The presented chart shows that after the oscillator line drops below the value of -100, it quickly turns around and begins to rise upward. This signal means that the price will soon also change direction. Therefore, if such situations arise, it is recommended to place an order to buy a binary option on the USD/CAD currency pair with a time frame of 15 minutes (less is possible).
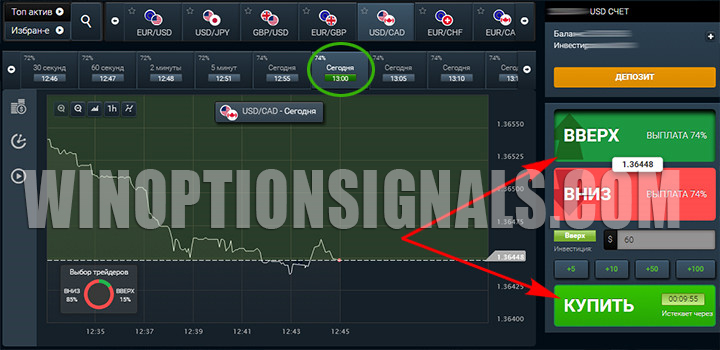
The example under consideration shows that if the price rises even by one point, the profit margin will be 74% of the initial investment.

Binary options strategies using an oscillator
CCI can be used separately from other technical tools. However, it is recommended to use this oscillator in conjunction with other indicators. This strategy is more effective because it minimizes the likelihood of false signals. In particular, CCI is used in conjunction with MACD , Stochastic or Bollinger Bands.
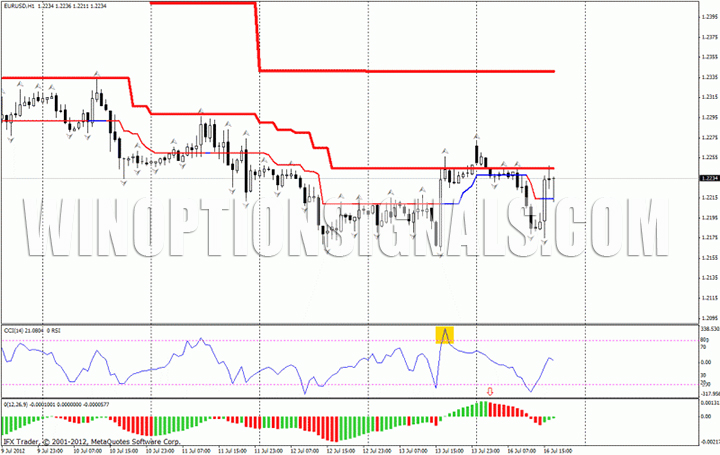
The operating principles of this oscillator are implemented in some other technical analysis tools. This is due to the fact that CCI is able to give leading signals, thereby increasing the chances of making a profit from binary options trading. In addition, the indicator can be used in various strategies .
Instructions for installing indicators in MetaTrader 4 :
CCI signals in binary options trading
CCI provides two types of trading signals. The first occur during a period when prices pass through overbought and oversold levels. The second type of signal is associated with a situation known as divergence (the discrepancy between the indicator's readings and the current price movement).
If the oscillator line passes through the +100 mark (overbought zone), this indicates a bullish market mood, when most traders place orders to buy the currency pair. In cases where the CCI line falls below -100 (oversold zone), this indicates a downward trend.

Breaking through these levels occurs relatively rarely. The oscillator line falls below or rises above the oversold or overbought zones, respectively, for 25-30% of the trading time. But this particular period is considered optimal for concluding binary options transactions.
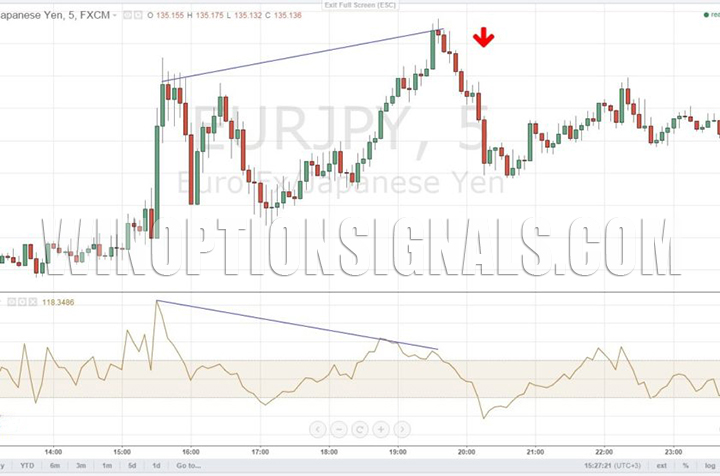
The state of divergence also opens up good opportunities for profit. If, for example, the indicator line goes down, but the price chart continues to move in the previous direction, this indicates an imminent change in the trend to a downward one.
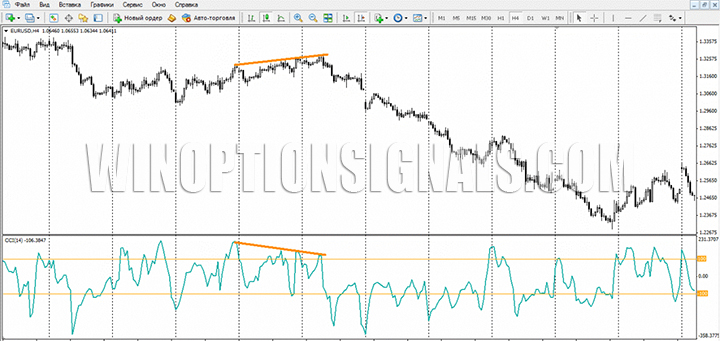
Another situation is possible when the oscillator indicates the beginning of growth, but the value of the asset continues to fall. Divergence is considered a strong signal that is not recommended to be ignored.
Divergence
It is recommended to place an order to buy an option if the indicator line begins to move up while the price chart continues to fall. Such conditions indicate that the downtrend is a temporary phenomenon. In such cases, the price continues to move downward by inertia, and a trend reversal should soon be expected.
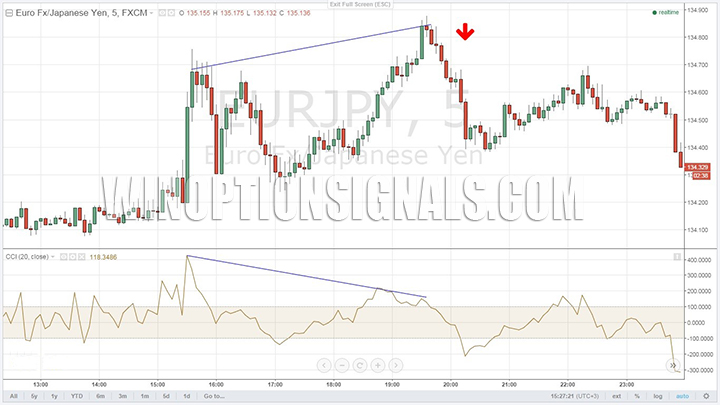
Similar recommendations should be followed during an uptrend. If the oscillator line moves down while the price of the asset continues to rise, you need to place an order to sell binary options.
Results
One of the features of the CCI oscillator is that its effectiveness is determined by the cyclical behavior of the selected asset. In this regard, experts recommend that beginners use the indicator when trading shares or exchange-traded assets. When applied to binary options, the effectiveness of CCI is reduced. To increase the accuracy of signals in the Forex market, you will need to fine-tune the indicator, which only experienced traders can do.
CCI is recommended to be used in conjunction with other technical analysis tools. This is especially true when trading binary options.
In the archive you can download the modified CCI indicator, which shows more clearly the overbought and oversold zones of an asset.
Download the CCI indicator
With this indicator look: RSI indicator , Stochastic indicator .
Can't figure out how this strategy or indicator works? Write about it in the comments to this article, and also subscribe to our YouTube channel WinOptionCrypto , where we will definitely answer all your questions in the video.
See also:
Indicators for binary options trading


To leave a comment, you must register or log in to your account.