Stochastic Oscillator is one of the most popular technical analysis indicators, along with indicators such as MACD, RSI and others. Stochastic is an oscillator type indicator. It can be used for both binary options trading and Forex trading.
The indicator can be used in binary options trading for:
- Determining the end of a correction in a trend movement.
- Determination of entry points for both buying and selling.
- Flat trading.
The stochastic oscillator is great for determining when to open a position. One of the advantages of the indicator is that it shows overbought and oversold zones. This gives additional signals for opening a position.
This indicator has been used by many traders around the world for a very long time, because it was created in 1950 by George Lane, who successfully traded using his invention for many years.
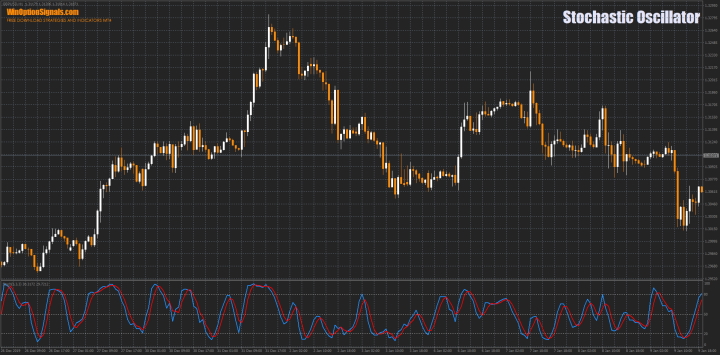
The essence of the Stochastic Oscillator indicator
The point of such indicators is to analyze the speed of price movement in a certain range with a specific minimum and maximum for a selected period. By receiving data from the Stochastic Oscillator, a trader can understand which price action is more likely to occur at the moment. That is, the price will go further along the trend or reverse.
The creator of the indicator based his assumptions on the fact that if there is a strong upward price movement (upward trend), the closing price of the selected time frame will be in the zone of the previous maximum price. When moving down (downward trend), the price will, on the contrary, be close to the previous minimum value. Stochastic consists of a number of algorithms to filter out “price noise”, which adds accuracy to its readings.
Stochastic indicator formula
Stochastic is calculated using data from the %K or “fast” Stochastic variable and the %D or “slow” Stochastic variable.
Formula for %K:

Where C(t) is the closing price of the selected period. Low(n) and High(n) – minimum and maximum of the previous ranges.
Formula for %D:

The conducted research shows that a simple average should be used for medium-volatile trading instruments, and exponential smoothing should be used for highly volatile trading instruments.
Stochastic Oscillator indicator settings and data
Regular Stochastic is a standard indicator in the MetaTrader 4 terminal and therefore you will not need to download it.
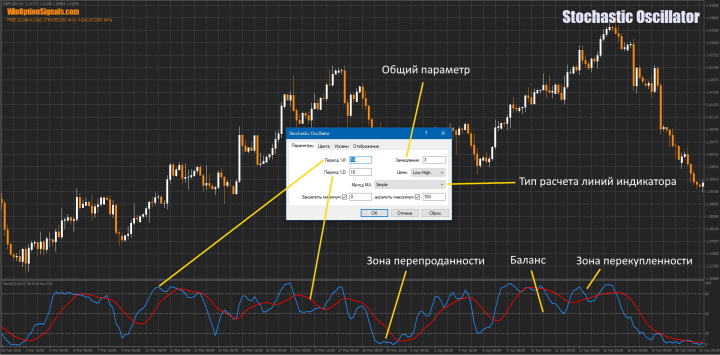
Stochastic, like most oscillators, contains a range setting with values from 0% to 100%. This data is displayed in the indicator window as gray dotted lines. Typically, the indicator uses levels of 20 or 30% and 70 or 80%. You can also use a level of 50%.
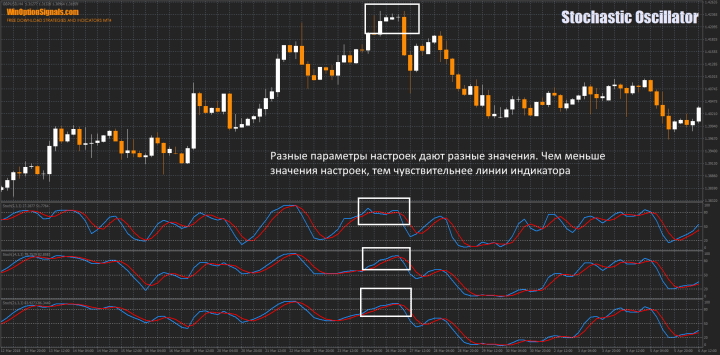
Nowadays, standard parameters of the indicator should not be applied to modern markets, especially since traders most often trade in currency pairs, while the indicator was created for the stock market. Therefore, it is advisable to configure the indicator manually and test all selected parameters on a demo account.
The higher the time frame that needs to be analyzed, the lower the value you need to select for the main Stochastic line. With a larger time frame, the indicator lags more and considers small fluctuations to be insignificant.
To select the correct indicator settings, you need to take into account the volatility of the instrument, time frame and asset type. For example, the standard setting with values of 5-3-3 works well on major currency pairs. For small time frames from M1 to M30, good results are obtained with settings 9-13. For hourly time frames, the recommended parameters are 13-5-3, and for H4 and higher charts – from 5 to 9.
Other parameters in the Stochastic indicator settings
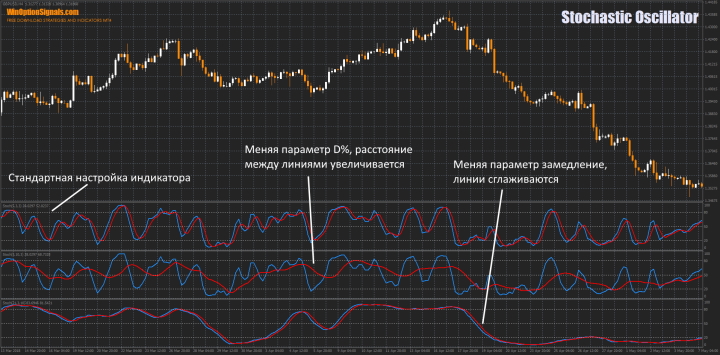
The remaining values in the Stochastic indicator calculate only the location range of the %K and %D guides. By increasing the Slowdown indicator, we will move both lines closer to the zero level. This will be useful for long-term trading because the number of signals will decrease. By reducing the “Slowdown” indicator, the indicator will quickly reach the overbought and oversold zones (values of 20% and 30%). This will give you the opportunity to see almost every major price reversal.
The %D ("smoothing") metric controls the number of K% metric values and averages the lines. By setting the value to “3”, the indicator will be plotted relative to the last three values. With this parameter, the intersection points of the lines shift relative to each other and their extreme values.
Characteristics of the Stochastic indicator
- Terminal: MetaTrader 4.
- Time frame: selected for the type of trade and indicator settings.
- Expiration: selected according to the type of trade and indicator settings.
- Types of options: Call/Put.
- Indicator: Stochastic Oscillator.
- Trading instruments: Any.
- Trading hours: 9:00-17:00.
- Recommended brokers: Quotex , PocketOption , Binarium .
Signals for entering a trade from the Stochastic Oscillator indicator
Stochastic Oscillator lines in the overbought zone from 70-80% to 100% are interpreted as bullish, and when falling into the oversold zone from 30-20% to 0% they are considered bearish.
If we consider situations when the indicator lines are at their extreme values in more detail, then it all comes down to the fact that the prevailing side is “fizzled out” by this moment, or is losing its positions. As a result, a reversal occurs. It is also worth considering the behavior of the indicator at certain levels. If Stochastic is near the 50% level, then the chances of a reversal are low.
Overbought and oversold zones of the Stochastic indicator
When the lines reach extreme zones, we consider the following options:
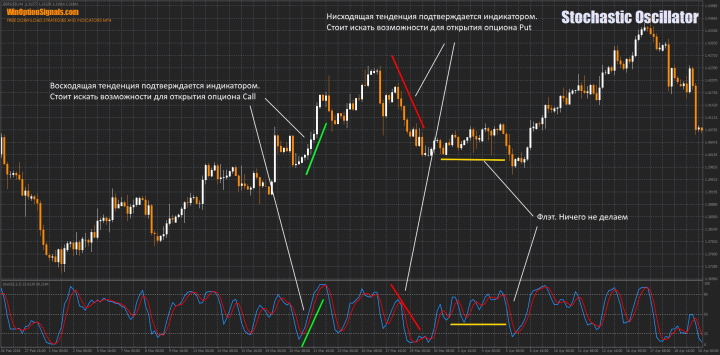
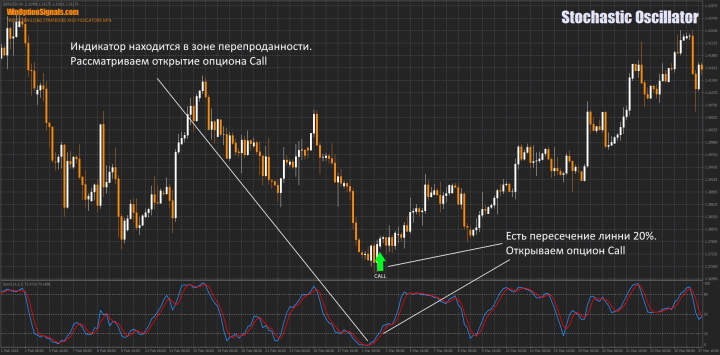
- An upward reversal of the indicator at an oversold level of 20-30% is considered a signal to open a Call option. When the %D line crosses the 20-30% line from bottom to top, we receive additional confirmation of the signal.
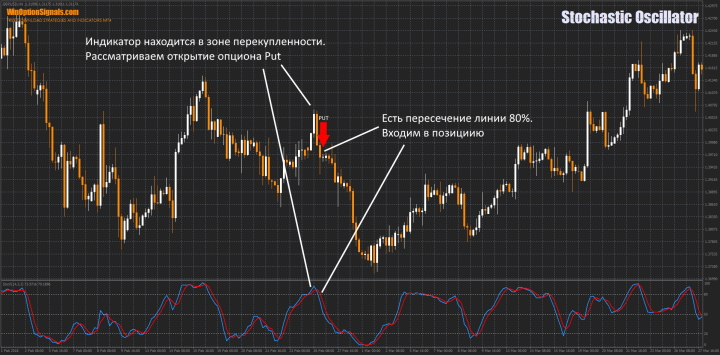
- A downward reversal of the indicator at an overbought level of 70-80% is considered a signal to open a Put option. When the %D line crosses the 70-80% line from top to bottom, we receive additional confirmation of the signal.
The current trend can be considered relevant as long as the indicator lines are in extreme zones.
Opening a Call Option
Opening a Put option
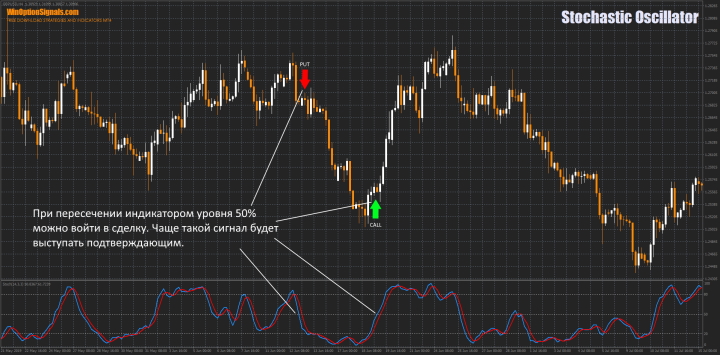
Breakout of the 50% level by the lines of the Stochastic Oscillator indicator
The average Stochastic line shows us who generally dominates the market right now. These are either “bulls” (above 50%) or “bears” (below 50%). If the indicator lines are at the 50% level, then this indicates uncertainty. But as soon as the indicator begins to move in a certain direction, the uncertainty disappears.
Opening a Call and Put option
The intersection of the K% and D% lines of the Stochastic indicator
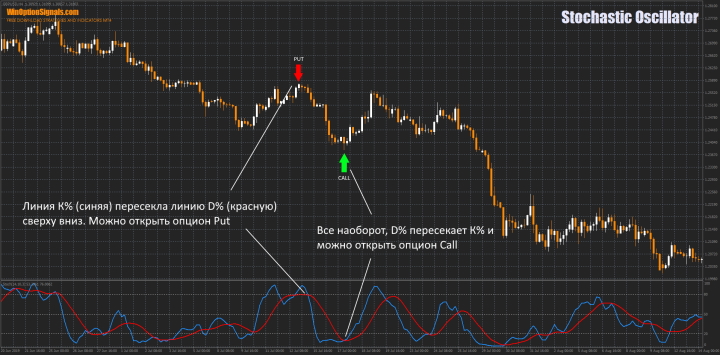
In addition to the standard indicator signals, there are also secondary signals. Crossing lines works best with indicator settings of 14-10-3. But it is worth noting that such settings may not be suitable for some assets, and especially such settings will not be suitable for the M1 time frame, since there will be a lot of false signals.
Opening a Call and Put option
Divergences of the Stochastic indicator
Stochastic can also be used for trading divergences. The meaning of divergences is the same everywhere and to understand how to use them, it is worth reading the article about the MACD divergence indicator and the Kwan NRP indicator for binary options . These articles provide complete information on the use of divergences on any indicators that show them.
If you intend to use Stochastic to search for divergences, then at the end of the article you will have the opportunity to download a modified indicator with automatic search for divergences and a template for it. The template in the archive is configured for the H4 time frame. If you need a different time frame, then change the “Time Frame” value in the indicator settings.
Instructions for installing indicators in MetaTrader 4:
Pros and cons of the Stochastic indicator
The advantages of this indicator include its versatility, since it can be used on any time frame and trade both trend formations and flat ones. The indicator also has very flexible settings, and each trader will be able to adjust it to their trading strategy.
The disadvantages include the fact that it makes no sense to use Stochastic in very volatile markets, because with sudden price movements, the indicator lines will give a lot of false signals.
Conclusion
After studying this material, you can understand that the flexibility of this indicator makes it possible to add it to almost any trading strategy for binary options. But in order to receive accurate signals, you will need to spend a lot of time selecting settings for a specific time frame and instrument. Despite all its advantages and disadvantages, this indicator is used by many traders around the world.
Don't forget that before using any indicators on a real account, be sure to test them on a demo. And if you don’t know which broker to choose for this, you can read our binary options broker rating and choose the one that suits you.
Download template and indicator Stochastic Oscillator Divergence MTF
Can't figure out how this strategy or indicator works? Write about it in the comments to this article, and also subscribe to our YouTube channel WinOptionCrypto , where we will definitely answer all your questions in the video.
See also:



To leave a comment, you must register or log in to your account.