The RMDS strategy for binary options is based on four oscillators, the readings of which are processed by the indicator algorithm and generate a single trading arrow signal.
Without a doubt, this is a useful tool for lovers of classic technical analysis , because RMDS allows you to add just one to the chart instead of four different indicators with flexible settings and clear signals. Alerts allow you to trade binary options using the RMDS strategy even on the shortest time frames on multiple assets simultaneously.
The system does not use any secret algorithms. The RMDS indicator is based on standard overbought and oversold oscillators, so it is distributed free of charge. You can download it on our website along with a convenient template for trading binary options.
So far, everything sounds exactly the way we like it: a completely transparent free tool with clear settings and good signals. Unfortunately, in practice, the indicator had a significant drawback. Fortunately, a solution was found for him too. Can this drawback affect the results of trading using the RMDS strategy, and how to avoid problems in using this useful tool - read further in our review.
Content:
- Characteristics of RMDS;
- Installing RMDS;
- RMDS overview and settings;
- RMDS Trading Rules;
- Opening a Call option;
- Opening a Put option;
- Conclusion;
- Download RMDS.
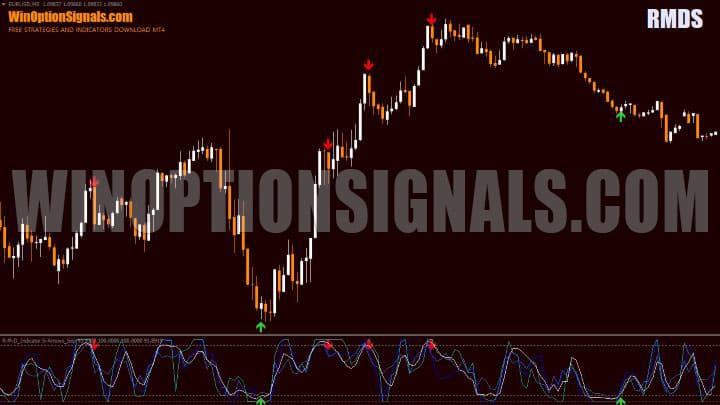
Characteristics of the strategy for binary options RMDS
- Terminal: MetaTrader 4 ;
- Timeframe: M1-H4;
- Expiration: 3 candles;
- Option types: Call/Put;
- Indicators:RM-D_Indicator S-Arrows_Sep.ex4, RM-D_S_Indicator -Arrows.ex4;
- Trading instruments: currency pairs , commodities, cryptocurrencies , stocks;
- Trading time: 8:00-20:00 Moscow time;
- Recommended brokers: Quotex , Pocket Option , Alpari , Binarium .
Setting up a strategy for binary options RMDS
RMDS strategy indicators are installed as standard in the MetaTrader 4 terminal. To do this, you need to add them to the root folder of the terminal by selecting “File” in MT4 and then “Open data directory”. In the directory that opens, you need to go to the “MQL4” folder and then to “Indicators”, and then drag the indicator files there. Templates are installed in the same way, but are placed in the “Templates” folder. More detailed instructions for installing indicators can be viewed in our video:
Review and settings of RMDS strategy indicators for binary options
The RMDS strategy package for binary options includes two indicators:
- RM-D_S_Indicator -Arrows
- RM-D_Indicator S-Arrows_Sep
Both of them work according to the same algorithm and have exactly the same settings. The difference is that the first one displays arrow signals on the chart, and the second duplicates the same arrows in the basement panel along with the oscillator readings:
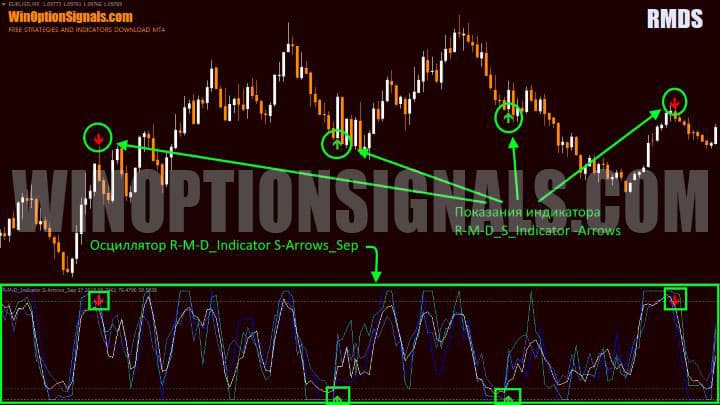
The RMDS Oscillator simultaneously displays four overbought/oversold indicators in the form of lines of different colors:
- Relative Strength Index RSI ;
- MFI Cash Flow Index;
- DeMarker;
- Stochastic .

An arrow signal to buy a Call appears when all four lines of the oscillator are in the oversold zone and a bullish white candle begins to form. For a Call signal, a bearish orange candle should appear while the RMDS oscillator indicators are in the overbought zone.
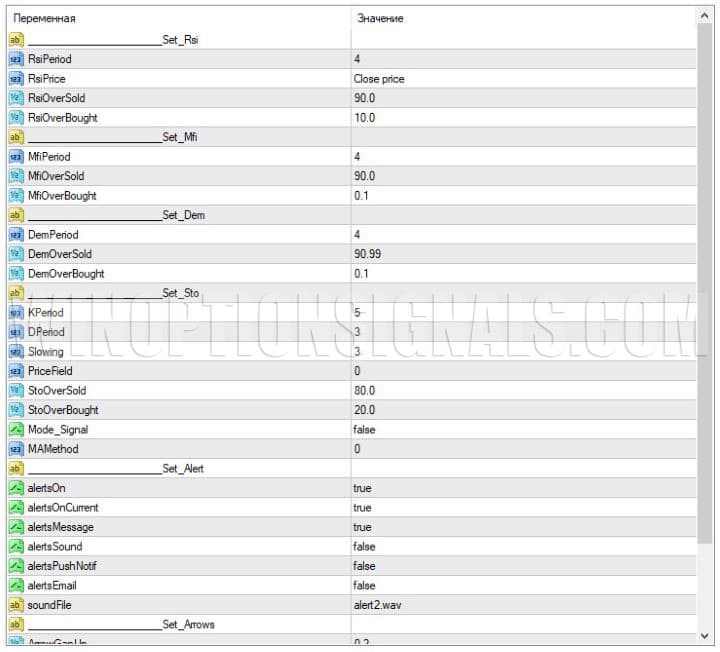
RMDS settings allow you to:
- Change the period, calculation method and boundary values for overbought/oversold RSI (Section Set_Rsi);
- Change the period and boundary values of MFI (Set_Mfi);
- Change the period and boundary values of DeMarker (Set_Dem);
- Change periods, deceleration, shift, boundary values and calculation method of Stochastic (Set_Sto);
- Set up alerts;
- Change the visual parameters of pointer signals.
Now let’s talk about a significant drawback of this strategy for binary options. If you look at the RMDS arrows on historical quotes, you will notice that in the vast majority of cases they correctly indicate the direction of the candle on which the signal appeared. Even during an aggressive trend movement, the indicator correctly points to rare candles formed in the opposite direction:
In real time, arrows begin to appear on each candle, as they are formed when the indicator is in the overbought and oversold zones, in which it can remain for quite a long time. But as a result, when the chart is updated, all the signals that were there disappear even when they turned out to be correct. This is what RMDS looks like in real time on the USD/JPY pair:
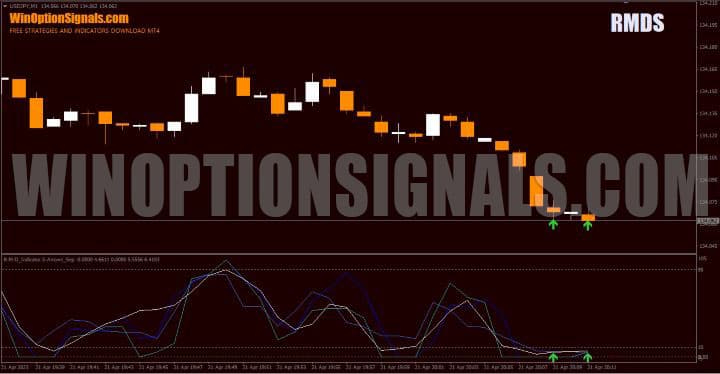
On historical quotes, the indicator formula works with the closing price of the candle, and not with the current price, so after reloading the chart, the signals simply disappear. Here's what the same graph looks like after a reboot:
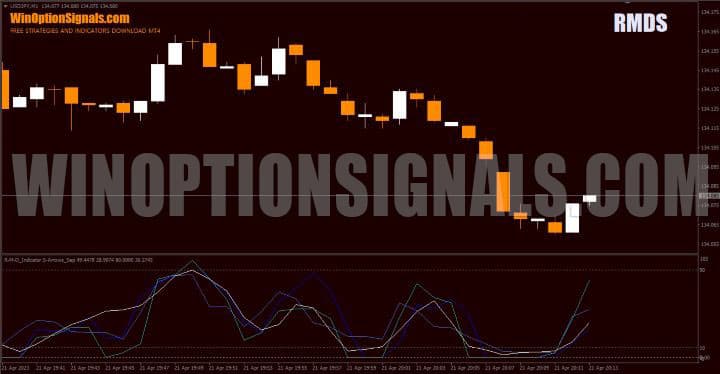
Redrawing of RMDS strategy signals for binary options is a significant drawback of the indicator, which complicates its objective testing on historical data. However, the tool can be useful in binary options trading because the oscillator readings remain correct. You can get the best results from its arrow signals, despite their instability, by using additional filters.
Trading rules using the RMDS strategy for binary options
In the rules of trading according to the RMDS strategy for binary options, it is important to take into account not only the specifics of the arrow signals of the indicator itself, but also the features of trading on the principle of overbought or oversold an asset.
In a strong trend, the indicators of the standard oscillators RSI, MFI, DeMarket and Stochastic, which form the basis of RMDS signals, will often be in the zones of their extreme values and generate false signals about an upcoming price reversal. To avoid trading on the premature arrow signals of this indicator, we should wait for the first signs of a local trend reversal, and only then buy an option.
According to our observations, one of the reliable confirmations for the RMDS indicator signals can be bullish or bearish engulfing candlestick patterns.
You can learn more about the use of candlestick patterns in binary options trading in our selection of materials:
- Candlestick analysis and binary options .
- Japanese candles for beginners and how to read them .
- Japanese candlesticks - graphical analysis.
- Using pin bars in binary options trading .
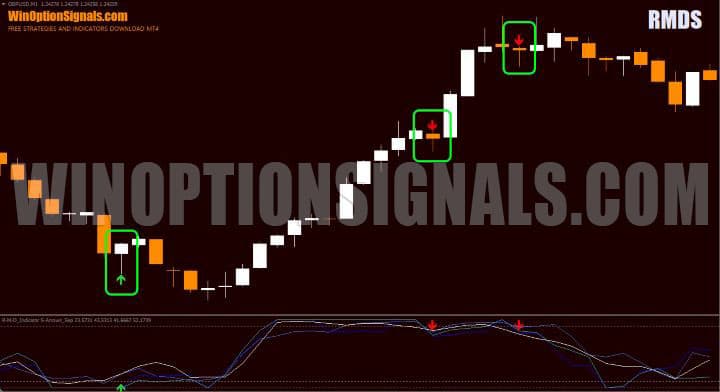
Using a bullish or bearish engulfing pattern as a filter for RMDS signals is very simple. To do this, you need to wait for the end of the formation of the candle on which the signal appeared. If at this point the price begins a reversal with the new candle absorbing the previous one, then the signal is confirmed, and you can buy the recommended option already at the opening of the next candle:

A complete overlap of the previous candle along with its shadows, as in the illustration above, is a stronger signal, but to confirm the RMDS signal, it is enough for only its body to be overlapped without shadows.
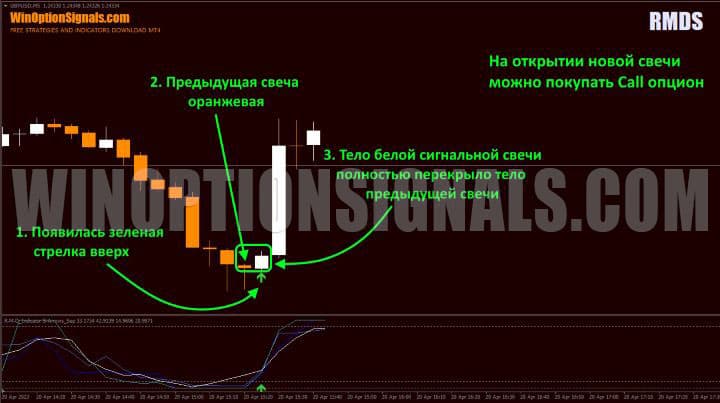
To purchase a Call option, the rules for trading binary options using the RMDS strategy will be as follows:
- A green up arrow signal appears.
- The previous candle is orange.
- A white candle has formed, the body of which overlaps the body of the previous candle (Bullish Engulfing pattern).
At the opening of the next candle, you can buy a Call option with an expiration of 3 candles. Any timeframe can be used.
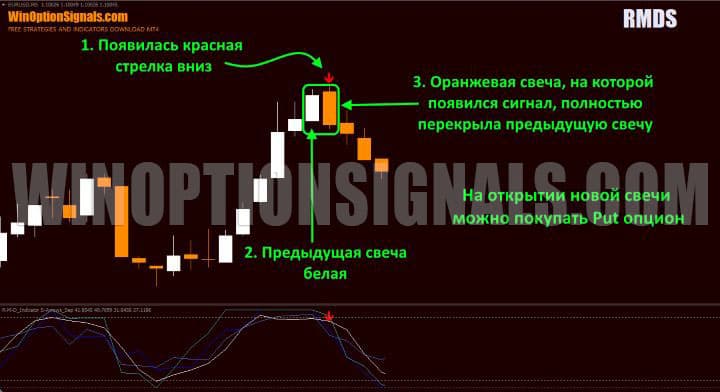
To buy a Put option:
- A red down arrow signal appears.
- The previous candle is white.
- An orange candle has formed, the body of which overlaps the body of the previous candle (Bearish Engulfing pattern).
Also, when signals are being generated, you should not update the chart, otherwise all signals will disappear.
Opening a Call Option
In this example, all conditions for purchasing a Call option are met. After the green upward arrow appeared, we had to make sure that the previous candle was orange, and the new candle on which the signal appeared had finally formed, overlapping the body of the previous one with its body. Thus, after receiving confirmation of the signal with the Bullish Engulfing pattern, it was possible to buy a Call option with an expiration of 3 candles.
Opening a Put option
To buy a Put option in the screenshot below, all the conditions of the strategy are met. The candle on which the red arrow signal appeared is orange. It completely covered the previous white candle, which means you can buy a Put option at the opening of the next candle.
Conclusion
When trading binary options using the RMDS strategy, the main obstacle for traders may be that the arrow signals of the RMDS indicators are redrawn when the chart is updated. This makes it difficult to test the operation of RMDS on historical data and increases the requirements for selecting signals for trading.
However, you can check the operation of the indicator and practice using signals in the MT4 backtester. The second problem is solved by connecting additional filters for the signals.
The RMDS indicator gives a convenient comprehensive signal for overbought and oversold assets, and the oscillator readings are reliable regardless of the arrow signals themselves, so the efforts in this case can be considered justified.
The above RMDS binary options trading strategy uses engulfing candlestick patterns as a filter, but on a demo account you can test for yourself other ways to select the best signals for trading, such as pin bars, chart patterns or additional signals from other indicators.
Whatever strategy you choose, do not forget to apply the rules of risk management and money management when trading on a real account, and trade only with trusted partners, which you can find in our rating of binary options brokers .
Download the RMDS strategy for free
See also:


To leave a comment, you must register or log in to your account.