

| Signal time | Around the clock |
| Average accuracy of online signal forecasts | 79% |
| Martingale | Not used |
| Currency pairs | Major currency pairs, gold, silver, Bitcoin |
| Working timeframes | M5, M15, M30, H1 |
| Number of patterns | 50 |
| Recommended Brokers | Quotex, PocketOption, Binarium, Binary.com, |
Register - register to always know when new strategies are added
This section is still undergoing optimization, and your opinion is important to us, due to this we have enabled the ability to comment directly on the widget page. You can now ask questions and, most importantly, point out shortcomings; if any pattern in your opinion worked incorrectly, be sure to report it and we will fix everything.
But the most important point at this stage will be to choose the optimal expiration, now it is set as 3 candles for all patterns, but perhaps you can optimize it more successfully.
How Can the Japanese Candlestick Widget be Useful?
Japanese candlestick patterns are a very powerful indicator of the Forex market, which means that when trading binary options it will set the general direction of the trend and you can use its signals as the main indicator of a trend change, combining with other indicators for binary options or our online signals.
At the moment, the widget can detect 50 such Japanese candlestick patterns: Hammer and inverted hammer, Bullish Harami, Bullish Engulfing Short candles in a star position, morning star in a three-candle position Short candle in Harami, Japanese Doji candles", Harami cross, Clearing in the clouds, or Piercing line, Double push Tweezers (Tongs) Absorption combined with hammer, Piercing line in tongs, Bullish abandoned child Strong bottom , “fortress”, Fast break and three new lows, “Bullish meeting line”, Triple gap on black candles, 8-10 new lows, “Bullish window”, “Bullish” game ending with a gap (gap), “Bearish harami” , “Bearish absorption, Bearish harami cross”, “Three-line star in thought” or in other words “repulsed attack of three white soldiers”, “Southern evening cross”, Doji in the “star reversal” position, “Bullish pincers”, “Bearish window", Three-candle "evening star", "Bearish" meeting line, "Bearish three-line breakout and resistance line", "Hangman", "Bearish abandoned child", Strong top, "fortress", 8-10 new tops (reverse situation of 8-10 new lows), “Bearish game ending with a gap”, “Three white soldiers”, “Three crows”, “Three decline method” and “Three rise method”, “Bearish” and “Bullish” gap “Tasuki” " Tasuki Gap, Three Simultaneous Wings, Bullish Gap Edge to White Lines Edge.
50 Basic Combinations of Japanese Candlesticks. Determining the Trends
Most experts agree that the most convenient chart for displaying the price movement of an asset is a candlestick chart. The color of a Japanese candlestick, the ratio of body sizes and shadows show the struggle between “bulls” and “bears” in a certain time interval. Various candlestick combinations give an idea of market trends and, along with other methods and tools of technical analysis (indicators, graphical models, support/resistance levels), allow one to predict a trend reversal. In this material we will look at the main patterns that indicate a change in direction or, conversely, a continued rise/fall in price. The term “pattern” means a combination or figure consisting of several Japanese candles.
The most popular type of interval chart today has been known since the 18th century. The creator of the candles is considered to be the owner of huge rice plantations, Homma Munehisa, who actively participated in trading on Japanese rice exchanges. He wanted to clearly see the highest and lowest price, as well as the cost of the product at the beginning and end of a certain time period. Due to Japan’s isolation and closedness from the outside world, the candlestick method of displaying price dynamics became widespread in Europe and the United States only at the end of the 20th century, thanks to the books of trader and analyst Steve Nison. The high information content of Japanese candlesticks was appreciated by exchange players, so they greatly displaced other methods of displaying prices (bars, line charts) and became one of the key tools of technical analysis. Japanese candlesticks not only clearly demonstrate the direction of movement of quotes, but also allow you to understand the current mood of sellers and buyers.
Candlestick Patterns Indicating a Reversal of a Downtrend
The Japanese candlesticks that we will describe first are called “hammer” and “inverted hammer ”. The hammer is characterized by a long wick (shadow) at the bottom, no upper shadow, and a short light body. The inverted hammer has a long upper shadow and a short dark body, with no lower wick. Typically, such candles are formed at the end of a downtrend and (like all combinations described below) indicate an upward price reversal:
The Bullish Harami combination includes two candles: the first has a long dark body, the second has a short light body and is located parallel to the first. Figuratively speaking, the first candle is, as it were, “pregnant” with the second. The word "pregnant" is "harami" in Japanese:
The reverse combination is called “bullish engulfing”. In this variant, the candle with a small dark body appears first, and then the light one with a long body:
The combinations considered are more common than all others. Those that we list below are formed much less frequently.
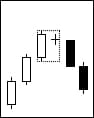
Short candles in a “star position”. A star is a compact candle with a short body and wicks. It should form below the previous candle (usually with an elongated body) and have a small price gap from it (gap). The third dark candle appears above the second and is also distinguished by the compactness of its body and shadows:
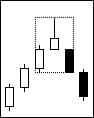
"Morning star in the 3 -candle position" . The combination begins with a long dark candle, which indicates a strong drop in price. The second star candle has a small body and begins with a separation from the previous one. The third is certainly light, meaning a strong upward movement. In this case, the final candle of the pattern should grow to the middle of the body of the first candle or higher. Ideally, a star candle should form with a gap relative to the left and right candles, but a gap with a third candle is rare:
Short candle in a harami position. The difference between this pattern and the “bullish harami” is that the second candle is not light, but dark. But it is also parallel to the first candle and is “inside” the boundaries of its body. The final candle must be light:
Doji are Japanese candlesticks that are formed when the minimum and maximum prices coincide or differ very slightly. They are similar to crosses, that is, the body is very short or just a line, and the wicks are quite long. Dojis forming among candles with large bodies can predict a price reversal:
"Doji" in "star position" . This combination is almost identical to the short candles in the “star position”, only the short candles are replaced by dodges. If, after the “dodge” has formed, the next candle is formed with a gap in the opposite direction to the trend, we can confidently say that during the period when the “dodge” was created, the “bulls” won in the market:
Harami cross. Everything here is similar to the previous harami positions, only the second candle is a “dodge”. The combination includes two candles. The first with a long body, within the boundaries of which there is a Dodge:
The penetrating line has another figurative name - “clearance in the clouds”. The pattern includes two candles. The first has a large dark body, the second has a large light body. In this case, the right candle opens below the minimum price level of the left one and grows to at least half of its body. It is typical that the stronger the second candle grows, the higher the probability of a trend reversal:
"Double Push". Here, after the dark candle of a downward trend, there is a light candle, which opens below the minimum price value of the dark candle and does not reach its middle. The next candle should also be light and located higher. That is, the light ones seem to “push” the bearish trend upward. If this combination is repeated twice, a reversal is possible:
Forceps or tweezers. The pattern includes at least two candles that form in a falling market. In this case, the candles must have equal price minimums. It doesn't matter what the candle looks like (large body, long wick, dodge, etc.). Particular attention should be paid to this combination after a long fall, although in general it does not give a very accurate forecast:
"Absorption" combined with "hammer" . This is a three-candle pattern. The first candle is a “hammer”, the combination of the 2nd and 3rd is “bullish engulfing”:
“Penetrating line in tweezers” - the pattern includes two candles and, as you certainly understand, combines two previously described combinations:
Bullish “abandoned child”. The combination includes three candles. The first is a long dark one, the second is a Dodge, the third is a long light one. The central candle is located below and with a gap from the left and right:
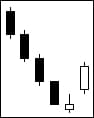
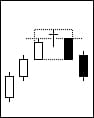
Strong bottom or fortress. This pattern usually marks the imminent end of a downward trend or a possible correction. Consists of 3 or more elements and ends with a candle that opens with a gap and grows upward:
Fast break + three new lows – in this model, a dark candle starts with a gap during a downward trend, then two more dark candles follow, after which a light candle also opens with an upward gap:
Bullish meeting line. A combination of two candles. A dark candle is formed in the first timeframe, and a light candle is formed in the 2nd. In this case, both close at the same or approximately the same level:
Triple gap on dark candles . This pattern on the daily timeframe consists of three dark candles, with each subsequent one opening with a price gap from the previous one. A good signal of a trend reversal, since after three days of decline the asset becomes heavily oversold:
8–10 new bottoms. They are formed during a strong bearish movement, when the minimum price level decreases several time frames in a row. Typically, traders close a trade when a reversal candle or combination is formed after a long fall. If, during a correction, light candles form eight to ten new lows, then a change in trend can be predicted. If less, the countdown starts over:
Bullish window. In a long-term falling market, a light candle forms. After this, a sharp jump upward is possible. The next candle opens with a gap, confirming the reversal:
A bullish game that ends with a gap. The model is characterized by alternating light and dark candles in approximately the same price range, which indicates a struggle between “bulls” and “bears”. As a result, an upward gap occurs and a trend change occurs:
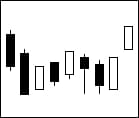
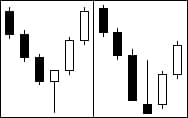
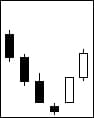
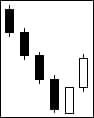
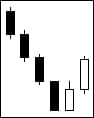
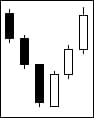
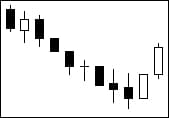
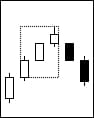
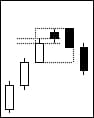
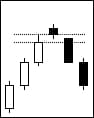
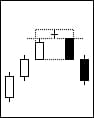
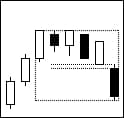
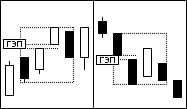
Below, see a combination of four different combinations: inverted hammer, strong bottom, doji, and bullish engulfing :
Candles and Candlestick Patterns Indicating a Reversal of an Uptrend
Bear Harami. Similar to bullish. The difference is that a large light body is formed first, and then a small dark one, which enters its boundaries.
Bearish engulfing. The reverse of the previous pattern. The left candle is short, light, the right is large, dark. The body of the 1st “inside” the body of the 2nd:
Falling star. It has a compact light body, the upper wick is very long, and the lower one is missing:
A bearish harami cross is formed from a combination of a large light candle and a dodge candle, which acts as a “baby”:
The three-line star is thoughtful. A pattern with such a lengthy name has another, even longer one - “repulsed attack of three white soldiers.” Moreover, behind such a complex name lies a very ordinary model, the image of which can be seen in the figure. Three light candles follow each other, with the closing level of the previous one coinciding with the opening level of the next one. Shadows are absent or very short. If the body of the 3rd candle (and sometimes the 2nd) becomes smaller and the shadows lengthen, it means that the pattern has formed. You should pay special attention to it after a long bullish movement:
Southern Evening Cross. This combination includes three candles. The first is a light candle, the maximum values of which are higher than the previous one. The second is a doji, the body line of which is also above the highs of the first candle. The 3rd candle is dark, without an upper shadow, and should open with a gap down from the closing level of the 2nd candle:
Star spread. Like the previous one, the model includes three candles. The 1st is light in color, the 2nd is dark, it opens with a gap relative to the price maximum of the 1st. The 3rd candle should also be dark in color, without an upper shadow, and its opening level should match the closing level of the 2nd candle or be slightly higher:
Doji in the “star reversal” position is a pattern almost identical to the previous one, except that the second candle is a “Doji”. Accordingly, the last candle in the combination (dark) should open above the maximum price values of the doji:
A bullish tongs pattern is a pattern of at least two candlesticks that forms in an uptrend. In this case, the candles must have equal price highs. It doesn't matter what the candle looks like (large body, long wick, dodge, etc.). Particular attention should be paid to this combination after long-term growth, although in general it does not give a very accurate forecast:
A bearish window is a three-candlestick combination. Moreover, the first candle is light in color, but the next one is dark and opens with a large gap relative to the closing price (and even lower than the opening price) of the first candle. The 3rd candle is also dark and is formed almost parallel to the second:
Evening Star. The combination is also built on three candles and is the bearish counterpart of the “morning star”. The central one forms a compact body, and the shorter it is, the more likely a price reversal is. Its opening occurs with a gap from the initial candle of the pattern; the body can be either light or dark. The 3rd candle is dark, its opening level is lower than the closing level of the middle candle, and when closing it should reach at least half of the body of the first candle. The longer the body of the final candle, the more serious the bears’ mood:
Bearish “meeting line”. A combination of two candles. A light candle is formed in the first timeframe, and a dark candle is formed in the 2nd. In this case, both close at the same or approximately the same level. The 3rd dark candle opens at the same level at which the second candle closed:
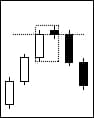
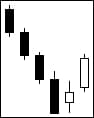
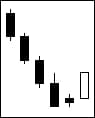
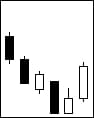
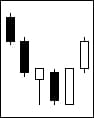
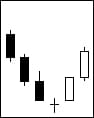
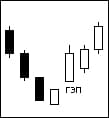
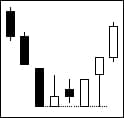
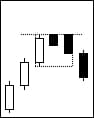
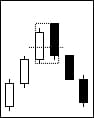
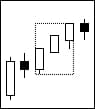
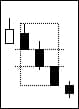
Bearish three-line breakout + resistance line. This combination is clearly demonstrated in the figure below:
Hangman. This candle is very similar to a “hammer”, has a short body without an upper shadow and a long lower wick. The difference is that it is formed during an upward trend. Can be either light or dark color:
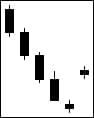
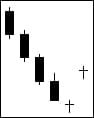
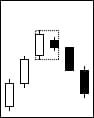
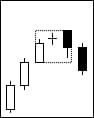
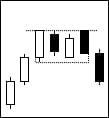
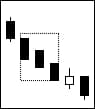
Bear's "abandoned child" . A three-candle pattern identical to the one that occurs in a bull market. We have already talked about it earlier. Includes a long light candle, a gap doji and a long dark gap candle as seen in the image:
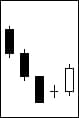
Dark covering cloud. The combination is the opposite of "clearance in the clouds." It includes two candles - with a large light body and a large dark one. The opening level of the dark candle is located above the maximum level of the light candle, and the closing level falls below half the body of the first candle. Moreover, the longer the last body, the more likely a change in the direction of price movement:
Strong top or strength. This pattern usually marks the imminent end of an upward trend or a possible correction. Consists of 3 or more elements and ends with a dark candle that opens with a gap from the previous dark candle:
8–10 new peaks. They are formed during a strong bullish movement, when the maximum price level rises on several time frames in a row. Typically, traders close a trade when a reversal candle or combination is formed after a long rise. If, during a correction, dark candles form eight to ten new highs, then we can talk about a change in trend. If less, the countdown starts over:
A bearish play ending in a break. The formation is an alternation of light and dark candles. Ultimately, the candle opens with a gap upward and the direction of price movement changes:
Patterns Signaling Trend Continuation
Combinations that predict a trend reversal are quite easily recognized on the chart and help build a successful trading strategy. At the same time, we advise you to pay attention to patterns of continuation of trend movement, since they allow you to understand the mood of the “bulls” and “bears” and “squeeze” the maximum out of the market
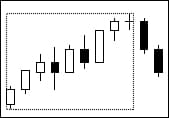
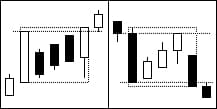
Three white soldiers. The combination is formed during a period of clear bullish strength and indicates that the market is inclined to grow. It consists of three light candles without shadows or with short shadows, the closing levels of which gradually increase. At the same time, the opening levels of the 2nd and 3rd candles are “in the bodies” of the previous ones, and there is no noticeable decrease in the size of the bodies. When such a pattern develops after a long bearish trend or during a local sideways trend, it indicates a powerful defense of their interests by buyers. Therefore, in the near future we can predict a rise in quotes:
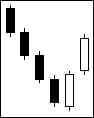
Mirror formation – “Three Crows.” This model consists of three long dark candles with small wicks that are arranged in a “ladder”. In this case, the opening price of the next candle is within the boundaries of the body of the previous one. The pattern usually indicates weakness in the bullish trend and the likelihood of a sharp decline in prices:
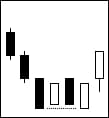
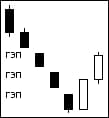
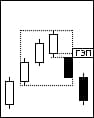
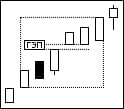
Methods of "3 declines / 3 ascents". The combination has an unusual structure and includes five or more candles. The first long candle closes along the trend (can be either light or dark), then several small candles are formed, usually of the opposite color, and then the last candle appears, colored similarly to the first:
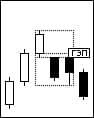
Let's look at the three-reduction method in more detail. The first candle is a dark color combination with a large body and short wicks. The next three candles (there can be 2 or 4 of them) have short light bodies and are located within the body of the first candle. The last candle is long, dark in color, and closes well below the lows of the initial candle. After the completion of the pattern, the price movement usually continues downward, which is what the bears want.
Be sure to note that the last candle of the pattern must close above the high of the first candle (for the three decline method) or below the low for the three rise.
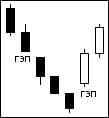
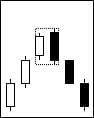
Gap (gap) “Tasuki” is relevant both in an upward and downward trend. This pattern includes three candles and marks a continuation of the movement. The first two candles should be “bullish” in an uptrend, or “bearish” in a downtrend. An indispensable condition is the presence of a gap between the closing levels of the 1st candle and the opening of the 2nd. The last candle is of the opposite color, with the opening level within the body of the second candle, and the closing price within the gap or slightly lower/higher:
3 simultaneous wings. This pattern includes three candles, the bodies of which are arranged in a regular “ladder”. In this case, the 2nd and 3rd candles start from the same price level at which the previous one closed:
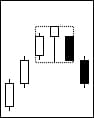
Bullish gap (break) “edge to edge of light lines.” Consists of 3 light candles. The 2nd and 3rd have bodies of approximately equal size, open at close levels and are separated from the first by a gap. In the event that the closing level of the 4th candle exceeds the highest candle of the pattern, we can assume the continuation of the uptrend:
Conclusion
To summarize, we would like to remind you that there are many technical analysis tools that allow you to predict market behavior. Japanese candlesticks should be in the arsenal of every trader, and their use in conjunction with the readings of oscillators and trend indicators can provide fairly accurate signals for making profitable trades. We also advise you not to forget that effective deposit management requires compliance with money management rules. The optimal ratio of profit and risk is the key to successful trading.
To leave a comment, you must register or log in to your account.