
Japanese candlesticks are among the most popular chart types in binary options trading. They can be used for profitable trading without relying on binary options strategies or indicators and simply displaying prices.
This type of trading becomes possible thanks to candlestick patterns, which even beginners can easily use after studying candlestick analysis in binary options.

What is Candlestick Analysis of Binary Options?
Traders have used candlesticks to display prices for a long time. Still, not all over the world, and the name "Japanese candlesticks" did not appear for this display method for nothing.
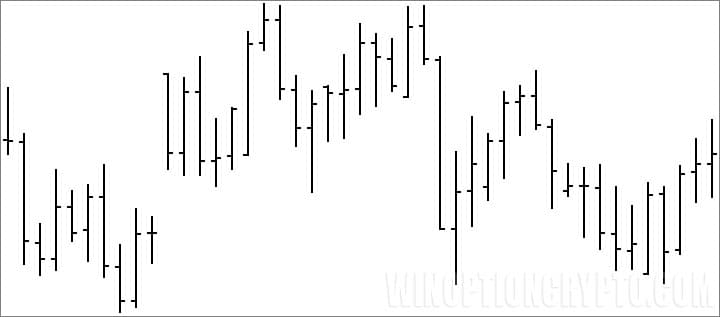
The Japanese trader H. Munehisa was the first to use candlestick charts in trading, and the rest of the world learned about this display method only at the end of the 20th century. Before the candlestick chart, the most popular chart was the bar chart:
In the USA, candlestick charts became known thanks to Steve Nison, the financier of the large American bank Merrill Lynch, and his book "Japanese Candlesticks." At that time, this book was one of the most popular in trading circles.
Candlestick analysis involves searching for candlestick patterns, usually consisting of 2-3 consecutive candles. Still, before moving on to the patterns themselves, it's worth understanding the structure of candlesticks:
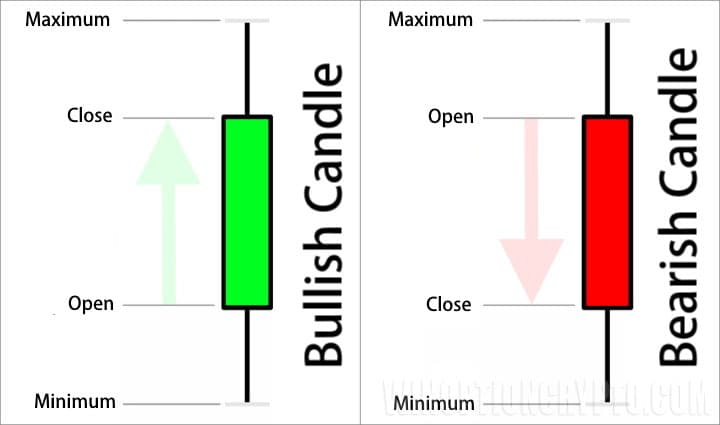
As you can see in the image above, each candle has a body (open to close) and shadows (price highs and lows). It doesn't matter whether the candle closes up or down, as all candles follow the same structure.
Candles and Candlestick Patterns in Candlestick Analysis of Binary Options
Binary options candlestick analysis consists of candlestick patterns, individual candles, and their combinations. Each candle may be similar to the others, but they all differ in meaning.
The beginners may struggle to see the correct candles or formations initially. To overcome this, you can use Japanese candlestick indicators, which find and automatically mark many types of candles on the chart.
Candles in Candlestick Analysis of Binary Options
In candlestick analysis of binary options, you should pay attention to the shadows of the candles, as they indicate the possible mood of the market. Please pay attention to the following:
-
Shadows of equal length. Such shadows indicate uncertainty in the market, and if such candles (spinning tops) appear on the chart, then it is better to refrain from transactions and see how the price will behave further.
-
Long shadows on one side. If the upper shadow is larger than the lower one or vice versa (pin bars or hammers), this indicates aggressive buying or selling (depending on which shadow is larger), and at such moments, one can judge the market's activity and desire to move in a certain direction.
-
No shadows. Suppose the candle has a vast body and very short or absent shadows (Marubozu brothers). In that case, this indicates the presence of a strong trend. At such moments, it is worth considering buying options only for such candles.

Several other types of candles can indicate the possible direction of the market, and these are:
-
Doji
-
Star
-
Gravestone
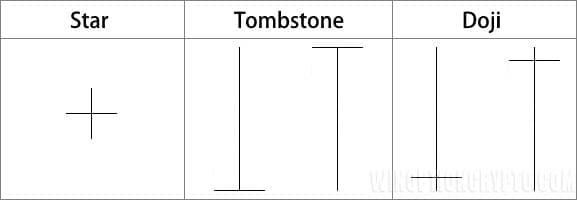
Understanding what such candles look like is important since many candle formations are based on them, which will be discussed later.
Candlestick Patterns in Candlestick Analysis of binary Options
There are a lot of candlestick patterns in the candlestick analysis of binary options:
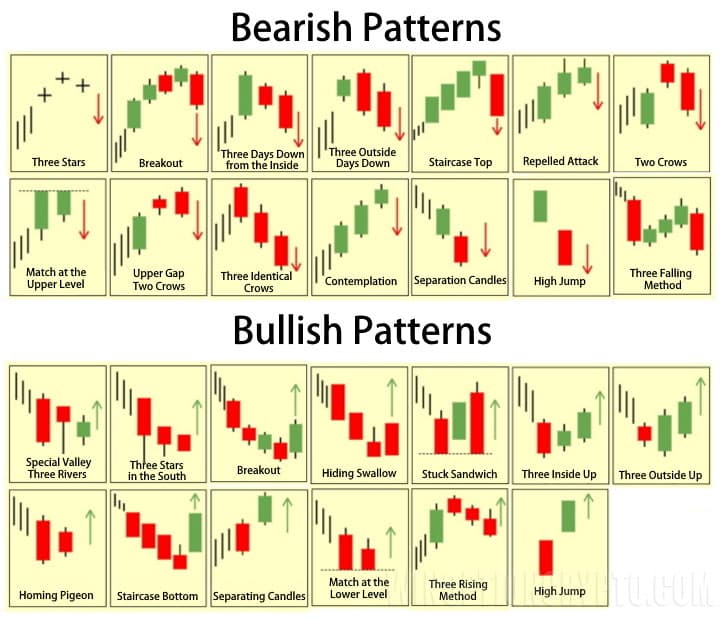
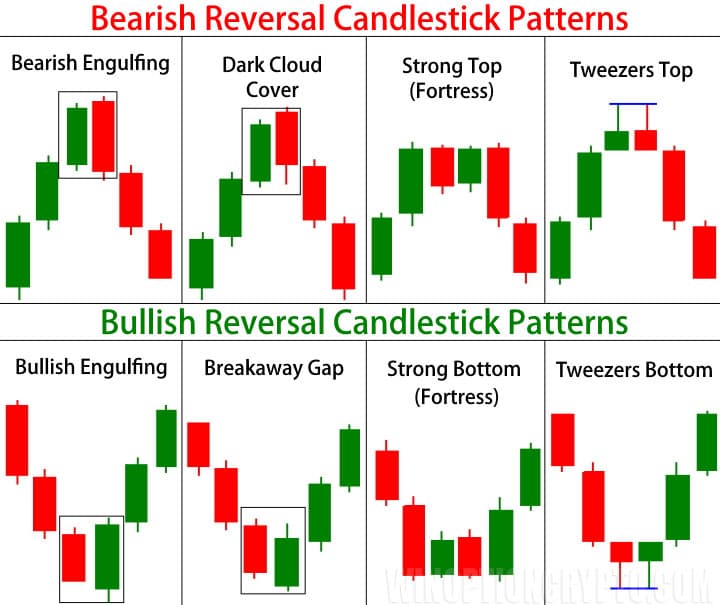
But, of course, there is no point in studying them all, as most of them rarely appear on the chart, mainly on the older timeframes. Still, the most frequent patterns are worth remembering:
-
Absorption (first column in the image below). The essence of this shape is that the new candle overlaps the previous one with its range. Most often, it is enough to overlap only the candle's body. Still, a stronger signal will be the overlap of the body and shadows of the previous candle.
-
A gap in the clouds and a dark veil (second column in the image below). This figure is visually similar to engulfing, but its essence is to update the minimum (for a downward movement) and the maximum (for an upward movement), then close in the other direction without completely covering the range.
-
Substantial top/bottom (third column in the image below). This construction is most often observed at support and resistance levels since the high or low is not updated, after which the price reverses
-
Tweezers (fourth column in the image below). This pattern arises rarely, but it is pretty accurate. It consists of two identical candles (such as two pin bars, two doji candles, or two crosses), and the maximum/minimum does not update for them.
Conclusion
It is worth paying special attention to the fact that any candles or formations that can be found through candlestick analysis of binary options should be used only according to the trend , since against the trend they can have either a very weak effect or no effect at all.
If reversal patterns are used, then a prerequisite is confirmation of these patterns (price movement towards the signal).
And the main thing is not to forget that any method should be mastered as fully as possible, then tested on a demo account , and only then move on to real trading.

To leave a comment, you must register or log in to your account.