
The Candle Meter binary options indicator is able to reflect events that have long been considered reliably hidden from the eyes of an inexperienced trader. First of all, this concerns the struggle between supply and demand, which many have probably heard about, but certainly could not see. The Candle Meter indicator literally visualizes this process, making it clear and accessible for analysis.
With this knowledge, you will know exactly who controls the market here and now. That is why the price of $199 for such an instrument does not seem so exorbitant to us. With certain knowledge that we will share in this review, you will be able to predict how the next candle will close. What else do you need for successful binary options trading? Find out how to improve your trading skills in practice and reach new heights in trading.
Content:
- Characteristics
- Installation
- Overview and Settings
- Candle Meter Trading Rules
- Opening a Call Option
- Opening a Put Option
- Conclusion
- Download Candle Meter
Characteristics of the Indicator for Binary Options Candle Meter
- Terminal: MetaTrader 4
- Timeframe: M5
- Expiration: 3 candles
- Option Types: Call/Put
- Indicators: Candle Meter.ex4
- Trading instruments: currency pairs, commodities, cryptocurrencies, stocks
- Trading hours: 8:00-20:00 Moscow time
- Recommended brokers: Quotex, Pocket Option, Alpari, Binarium
Installing the Candle Meter Binary Options Indicator
The Candle Meter indicator is installed in the MetaTrader 4 platform as standard. To do this, you need to add it to the root folder of the terminal by selecting “File” in MetaTrader 4 and then “Open data directory”. In the opened directory, you need to go to the “MQL4” folder, then to “Indicators” and move all the files there. Templates are installed in a similar way, but are placed in the “templates” folder. You can read the installation instructions in more detail in our video:
Review and Settings of the Indicator for Binary Options Candle Meter
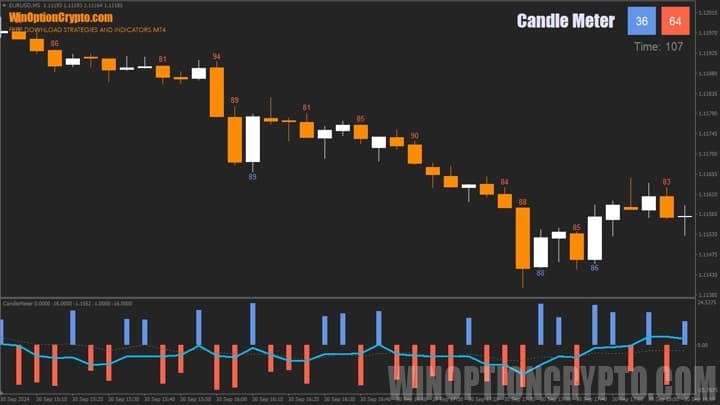
The Candle Meter binary options indicator analyzes the strength of buyers and sellers in each candle. Information about who won in the previous 5 minutes, 15 minutes or 1 hour, depending on the current timeframe, is displayed under each candle, transforming the standard candlestick chart into an informative tool for analyzing market trends.
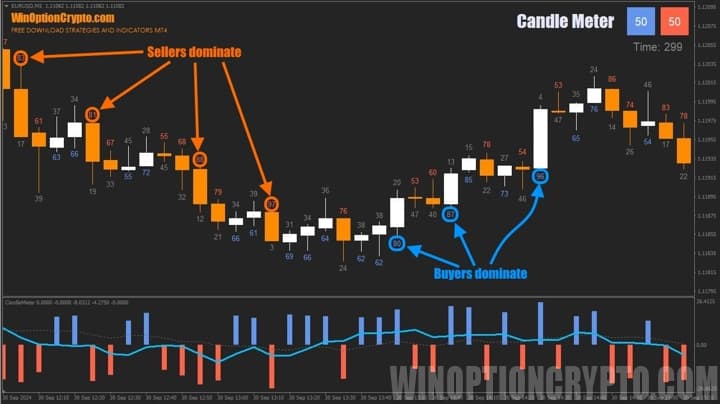
As you can see in the screenshot above, knowing which of the traders won the battle over the previous time interval can tell you with confidence where the market is going. If the number above the candle is above 80, the bears have won and prices will start to fall; if the value below the candle is above 80, the bulls are dominating the market and prices are rising.
Also pay attention to the indicator in the upper right corner of the chart. It shows the struggle between buyers and sellers in real time, and just below it is a timer counting down the seconds until the current time frame closes.
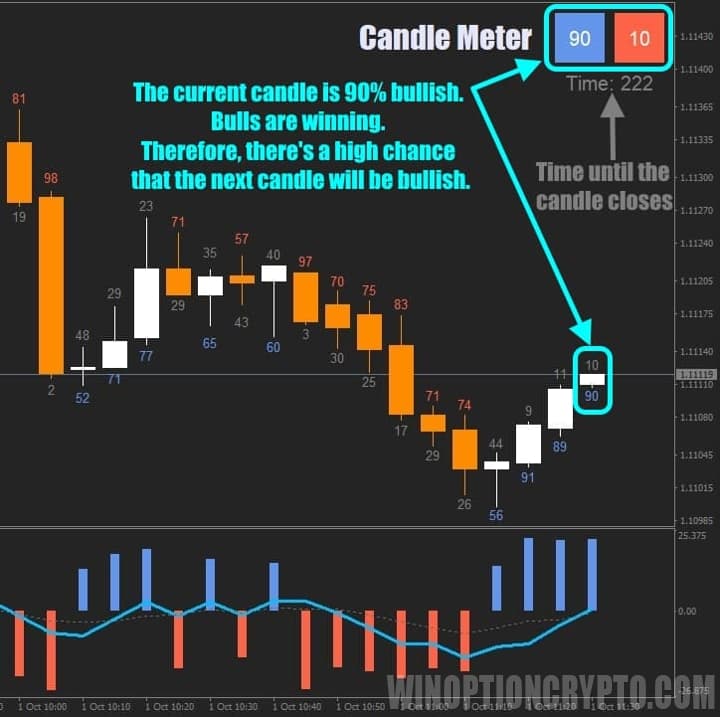
Interpreting the indicator values is very simple: the higher the number, the more bullish or bearish the candle, and the higher the chances that the next time interval will close with an increase or decrease in the quotes of the analyzed asset.
For example, in the image on the left, the forces of the market participants are distributed 90/10 in favor of the bulls. This means that there is a high probability of continued growth. However, to be completely sure of this, you should wait until the candle closes, since before that moment the balance of power in the market can change at any time.
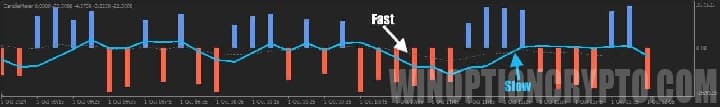
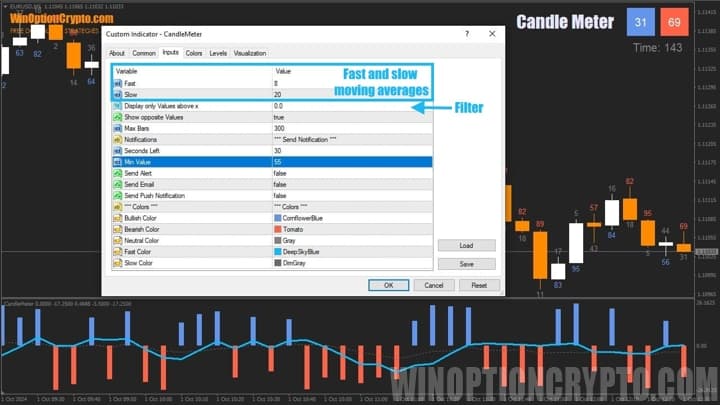
In addition to the main chart, the Candle Meter binary options indicator displays additional information in the form of a histogram and two moving averages.
As you might guess, this histogram helps to visualize the dynamics of the balance of power in the market over time. Thanks to it, a trader can clearly see the change in supply and demand, as well as identify patterns that have better predictive properties.
This tool has few settings. The user can change the histogram parameters for calculating moving averages, enable the bar display filter, which will only display numbers no less than specified, activate alerts and customize the appearance of the indicator's visual elements.
Trading Rules for Binary Options Indicator Candle Meter
The Candle Meter binary options indicator will warn the user in time about an upcoming trend change, which means that trading with it is not only pleasant, but also profitable. Let's figure out how to do this.
First of all, let's remember the well-known postulate about the benefits of trend trading. Trend trading is more successful in the long term, so we will open all transactions using the Candle Meter indicator in its direction. It only remains to find out how to determine the trend using this indicator.
It's simple. As mentioned above, Candle Meter not only calculates the strength of candles, but also displays an oscillator with two moving averages at the bottom of the chart. This is what we will need to determine the trend.
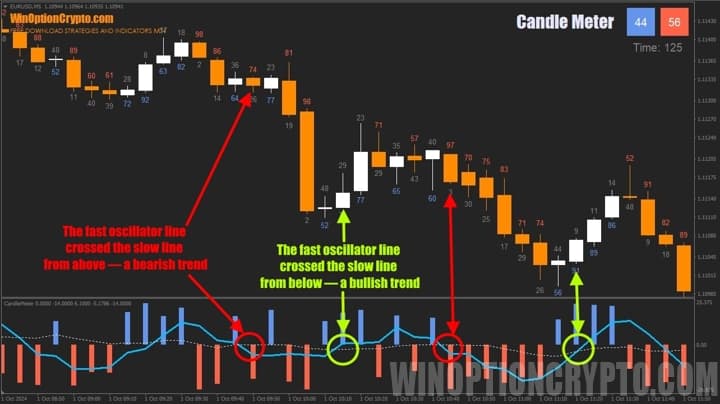
When the fast moving average crosses the slow one from top to bottom, it indicates the beginning of a bearish trend. When the opposite happens and it crosses from bottom to top, the bulls dominate the market, and such behavior of the oscillator warns of the beginning of a bullish rally. You can learn more about how the trend works in the markets from a special selection of articles on our website:
- How does a trend work in the markets?
- Identifying and using bullish and bearish trends.
- Market phase changes.
- How to identify a flat market?
As an additional filter for trading signals, we will set the minimum threshold for displaying the pressure of sellers and buyers at 80. Now the indicator for binary options Candle Meter will display on the chart only numbers equal to or greater than 80, which will help filter out insignificant intersections of the averages of the "basement" oscillator.
Opening a Call Option
- We are convinced of the presence of a bullish trend – the short moving average of the oscillator crossed the long one from bottom to top.
- The number >=80 appeared under the last closed candle.
- At the opening of a new candle we buy a Call option.
Opening a Put Option
- We are convinced of the presence of a bearish trend – the short moving average of the oscillator crossed the long one from top to bottom.
- The number >=80 appeared above the last closed candle.
- At the opening of a new candle we buy a Put option.
It is recommended to select the expiration time of 3 candles. We advise you to select the holding period of positions based on the results of testing on historical data.
Specifics of Using the Indicator for Binary Options Candle Meter
The Candle Meter binary options indicator can be used in a variety of ways, and not only in conjunction with its basement oscillator. For example, it can be used to determine the moments of completion of a rollback within the current trend. In this case, the main trend can be determined using one of the best trend indicators, and the moment for opening a deal - by decreasing pressure from sellers or buyers, depending on the planned direction of trading.
Before the end of a bearish trend pullback, buying will dry up and the numbers under the candles will decrease. In the case of a bullish trend pullback, the opposite situation will be observed - as the end of the correction approaches, sellers will lose strength and the numbers above the candles will decrease.
Pros of the Candle Meter Indicator
The advantages of this tool include the ability to observe the struggle between supply and demand in real time. Using figures that reflect the percentage of transactions made by buyers and sellers over a certain period of time, a trader can get an objective idea of the state of affairs on the market of a specific asset and understand who controls the current situation. If buyers prevail, the candle will close with growth with a percentage of purchase transactions of more than 80%. In the opposite situation, when sellers are in the lead, the candle will close with a decrease in prices and a percentage of sales of more than 80%.
Cons of the Candle Meter Indicator
To reduce the number of false trading signals of the indicator, additional trend filtering may be required. It is necessary to individually select the level of display of the values of the prevailing side for transactions for each asset.
Conclusion
The Candle Meter binary options indicator allows a trader to look behind the scenes of market battles and quantify how strong buyers or sellers were over a specific period of time. This knowledge will help the user take a different look at familiar candlestick patterns and graphical analysis figures, and his trading will become more confident. After all, betting on leaders is much more pleasant than on outsiders, especially if your expectations are based not on internal intuition, but on mathematical calculations.
Considering that the Candle Meter binary options indicator opens access to exclusive information, we consider its price to be quite justified and assume that there are many options for its application. Therefore, we ask experienced traders to share their experience of use in the comments to this article. And we encourage beginners to use a demo account from one of the best brokers. And only after receiving stable results, move on to trading with real money, observing the rules of risk and capital management. We wish everyone successful trading!
Download Candle Meter Indicator

To leave a comment, you must register or log in to your account.