
In an effort to earn money in the binary options market, traders are constantly looking for new tools for accurate transactions. One of these tools is the WSI binary options indicator. Despite the fact that it is offered for free, it can become a valuable assistant for every trader. Based on a combination of two popular indicators - CCI and ADX , WSI generates simple and clear signals by changing the color of its histogram.
By adding one more condition to these trading signals, you can create a strategy with a high percentage of profitable trades. What exactly is this condition - we will tell you in our review. In addition, you will learn about the advantages, disadvantages and rules for using this interesting technical analysis tool. Find out how the WSI indicator can help you improve your trading results in the binary options market.
Content:
- Characteristics
- Installation
- Overview and Settings
- WSI Trading Rules
- Specifics of Аpplication
- Conclusion
- Download WSI
Characteristics of the Indicator for Binary Options WSI
- Terminal: MetaTrader 4
- Timeframe: M1
- Expiration: 3 candles
- Option Types: Call/Put
- Indicators:
- Trading instruments: currency pairs , commodities, cryptocurrencies, stocks
- Trading hours: 8:00 - 21:00 Moscow time
- Recommended brokers: Quotex, Pocket Option, Alpari, Binarium
Installing the WSI Binary Options Indicator
The WSI indicator is installed in the MetaTrader 4 platform as standard. To do this, you need to add it to the root folder of the terminal by selecting “File” in MT4 and then “Open data directory”. In the opened directory, you need to go to the “MQL4” folder and then to “Indicators”, then move all the files there. Templates are installed in the same way, but are placed in the “templates” folder. You can read the installation instructions in more detail in our video:
Review and Settings of the Indicator for Binary Options WSI
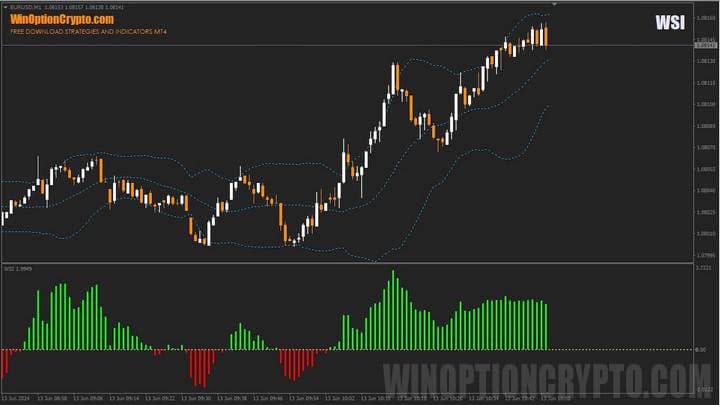
The WSI binary options indicator combines two popular tools: the Commodity Channel Index (CCI) and the Average Directional Moving Index (ADX). Both indicators are widely known and actively used in various trading strategies. For example, the Commodity Channel Index (CCI) helps traders assess the trend direction and identify potential price reversals. While the Average Directional Moving Index (ADX), developed by Welles Wilder back in 1978, assesses the strength of the trend, not its direction.
Thus, the WSI indicator helps traders not only correctly determine the direction of the market trend, but also assess its strength. To better understand its work, let's consider a specific example.
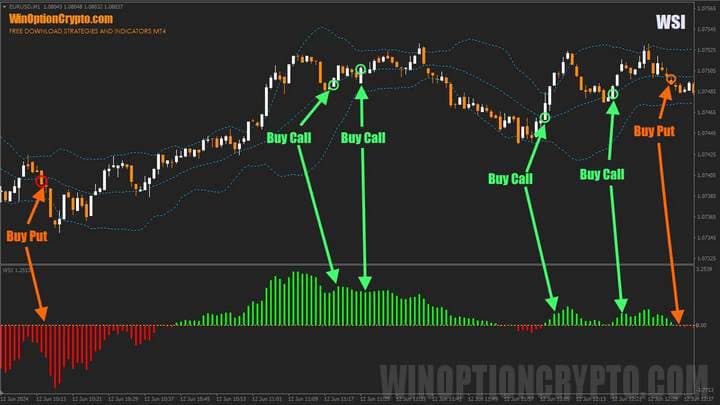
The figure above shows that when the trend changes from bearish to bullish, the WSI histogram moves from the negative to positive area, and the bars change color from red to green. The opposite situation occurs when the trend changes from bullish to bearish: the histogram moves from the positive to negative area, and the bars change color from green to red.
It's time to talk about WSI parameters.
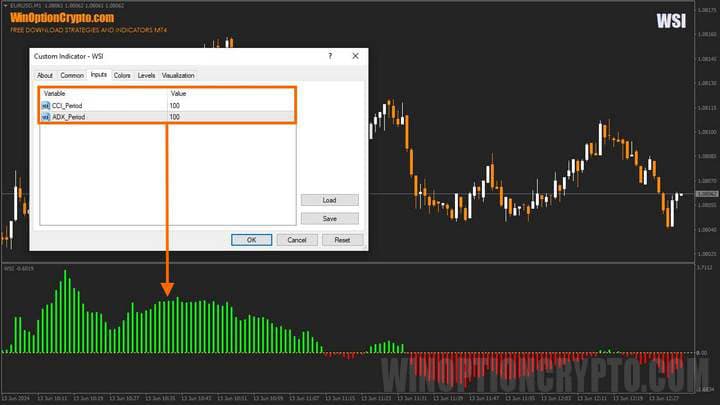
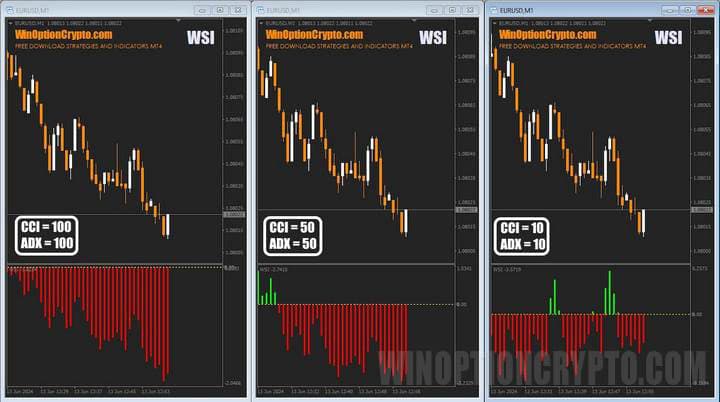
As we have already mentioned, the histogram is calculated based on two indicators. The user can only change the period of their calculation. The interval of 100 is used by default, and this setting has proven itself well for signals on the M1 timeframe for the EUR/USD pair. However, this does not mean that it should not be changed. We recommend selecting values based on the selected asset and the time period for trading.
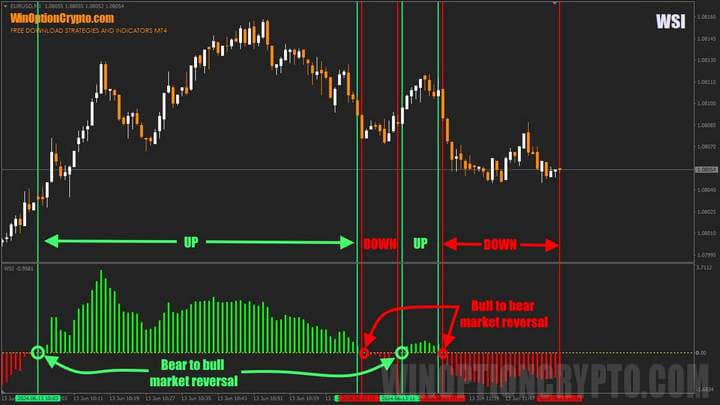
Now let's make sure that the WSI binary options indicator readings are indeed based on CCI and ADX, as we mentioned earlier. To do this, we will add these tools to the chart and compare their signals with the WSI readings.
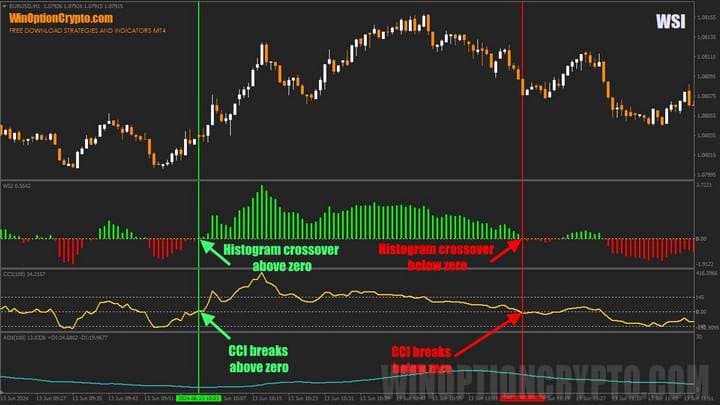
As you can see in the figure above, the appearance of the green histogram bar coincides with the CCI indicator line crossing the zero mark from the bottom up. At the same time, the appearance of the red histogram bar coincides with the CCI crossing the zero mark from the top down. The ADX value affects the size of the WSI histogram bars and does not participate in determining the direction of trading. As a result, the WSI indicator is calculated using the following formula:
WSI[i]=(CCI[i]*Price[i]* ADX[i]) / 1000
- CCI[i] – current value of the CCI indicator
- Price[i] – current price
- ADX[i] – current value of the ADX indicator
Rules for Trading on the Indicator for Binary Options WSI
Change the Color of the Histogram
There are several ways to use the WSI indicator for binary options trading. The simplest is to open positions when the histogram color changes: on the first green bar after the red one, we buy the Call option, and on the first red one after the green one, we buy the Put option.
For the M1 timeframe, these rules are sufficient to extract profit during active market hours if you use a 100-bar period to calculate the CCI and ADX indicators.

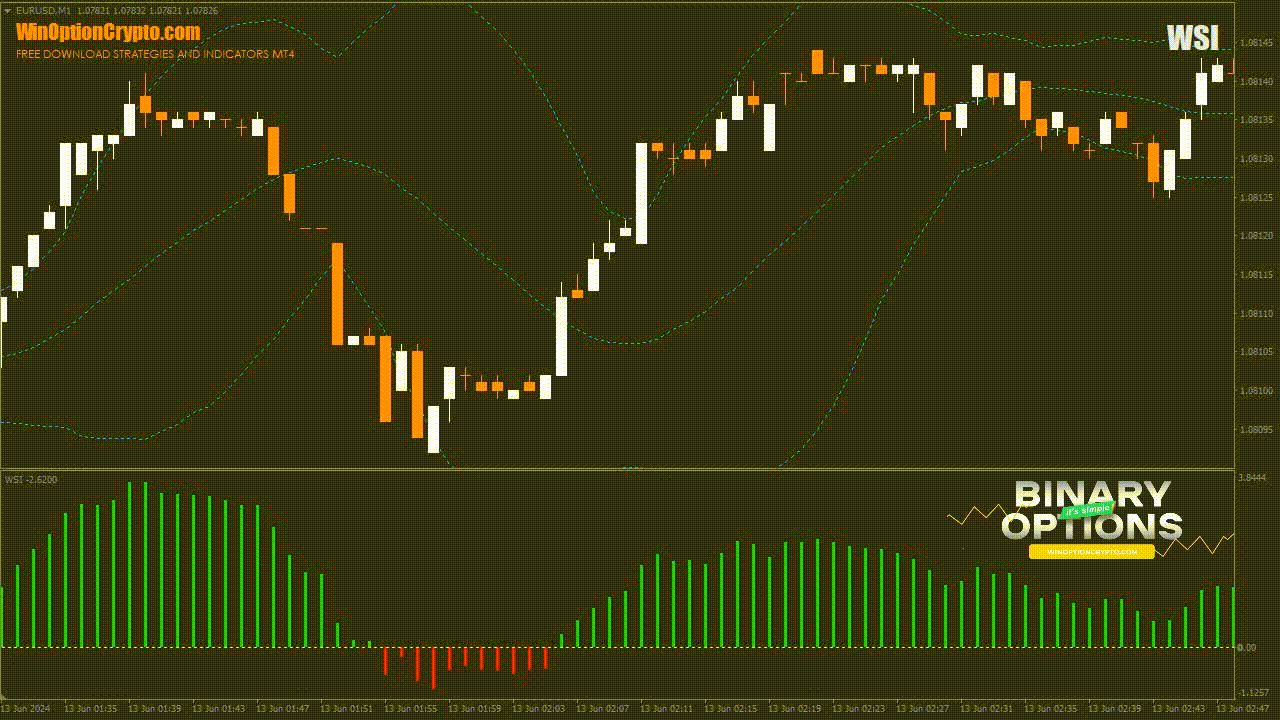
Breakout of the Middle Line of Bollinger Bands
Another interesting way to use the WSI indicator for binary options is to combine it with Bollinger Bands. In this case, to buy a Call option, you need to wait until the candle crosses the middle line of the Bollinger Bands and closes above it with a green bar of the WSI histogram. To buy a Put option, the rules are mirrored - we wait until the candle crosses the middle line of the Bollinger Bands and closes below it with a red bar of the WSI histogram. In this option, Bollinger Bands are used with a period of 20 and a deviation of 2.
As can be seen from the examples given, the use of the WSI indicator for binary options trading is based on following the market trend. If you do not yet have an understanding of how the trend works and how to correctly identify it, we recommend that you familiarize yourself with a special selection of articles on this topic:
- How does a trend work in the markets?
- Identifying and using bullish and bearish trends.
- Market phase changes.
- How to identify a flat market?
Our backtests have shown that using Bollinger Bands gives a higher percentage of profitable trades compared to trading without them. Therefore, all subsequent rules for buying Call and Put options will be based on this option.
Opening a Call Option
- We make sure that the WSI histogram is green (uptrend).
- The candle crossed the middle Bollinger band and closed above it.
- At the opening of a new time interval, we buy a Call option.
Opening a Put Option
- We make sure that the WSI histogram is red (downtrend).
- The candle crossed the middle Bollinger band and closed below it.
- At the opening of a new time interval, we buy a Put option.
It is recommended to select the expiration time of 3 candles. We advise you to select the holding period of positions based on the results of testing on historical data.
Specifics of Using the WSI Binary Options Indicator
Since the WSI indicator is a trend-following indicator, it should be used during active market hours to reduce the likelihood of getting into a flat. We recommend using it at the opening of the London and New York trading sessions. If you are not very familiar with the trading schedule of the financial markets, we recommend that you read our article “Best Time to Trade Binary Options”. In this article, you will learn about the main Forex trading sessions, their overlapping times, and the trading hours of the main stock markets.
It is also worth considering that small sizes of the WSI histogram may indicate a weak trend. Therefore, it makes sense to set a threshold value below which WSI signals can be ignored. The value of this filter is determined during testing.
Pros of the WSI Indicator
One of the main advantages of the WSI indicator is the trend approach to the formation of trading signals. Following them, you will automatically open positions in the direction of the main market trend. This in itself can have a positive effect on the results of your trading, since the probability of continuation of the price movement is usually higher than its reversal.
In addition, the signals of the WSI indicator are interpreted unambiguously, and the trader will not have to doubt in which direction to open a deal. It is enough to simply follow the rules described in the previous section.
Disadvantages of the WSI Indicator
The disadvantages of the WSI indicator include all the disadvantages of trend trading:
- Efficiency decreases in conditions of frequent changes in market direction and trading in price ranges. In such cases, the WSI indicator, like other trend indicators, can generate signals based on past price movements that have already lost their relevance.
- False Breakouts – Sometimes prices may break through the middle Bollinger band but then return to the previous trend, which can lead to losses.
- Not suitable for all markets – trend trading may be less effective in some markets: highly volatile or with short trends. Therefore, we recommend backtesting before using WSI.
Conclusion
The WSI binary options indicator combines the capabilities of CCI and ADX, helping traders better navigate financial market trends. It generates simple and clear signals based on the change in the color of the histogram. However, like any technical tool, WSI has its drawbacks. False breakouts and decreased efficiency in high volatility conditions require a cautious approach from the trader.
Before risking real money in binary options trading, test the indicator on a demo account with a broker with a minimum deposit . Choose the optimal settings for your asset and follow the rules of risk and capital management. Continue to study the materials on our site to learn more not only about indicators and strategies, but also about successful trading in general.
Download Binary Options Indicator WSI

To leave a comment, you must register or log in to your account.