
Volumes in binary options trading can serve as an important decision-making tool along with price charts, indicators and other technical analysis tools. The tick volume indicator for MT5 InTikO allows you to visualize volumes for each candle on the chart, which can be successfully used for cluster analysis and as an auxiliary tool in almost any dynamic trading strategy .
Please note that the tick volume indicator for MT5 InTikO is paid, but you can download it for free from our website for review.
Content:
- Characteristics of InTikO;
- Installation InTikO;
- InTikO overview and settings;
- Trading rules according to InTikO;
- Opening a Call option;
- Opening a Put option;
- Conclusion ;
- Download .
Characteristics of the MT5 tick volume indicator for binary options InTickO
- Terminal: MetaTrader 4 ;
- Timeframe: M1-H4;
- Expiration: 3-5 candles;
- Option types: Call/Put;
- Indicators: InTikO.ex5;
- Trading instruments: currency pairs , commodities, cryptocurrencies , stocks;
- Trading time: 8:00-20:00 Moscow time;
- Recommended brokers: Alpari, Grand Capital , World Forex ;
Installing Tick Volume Indicator for MT5 InTikO
The indicator is installed as standard in the MetaTrader 5 terminal. To do this, you need to add it to the root folder of the terminal by selecting “File” in MT5 and then “Open data directory”. In the directory that opens, you need to go to the “MQL5” folder and then to “Indicators”, and then drag the indicator file there. Templates are installed in the same way, but are placed in the “Templates” folder. The steps for MT4 and MT5 are identical, so detailed instructions for installing indicators can be found in our video:
Review and settings of the tick volume indicator for MT5 InTikO for binary options trading
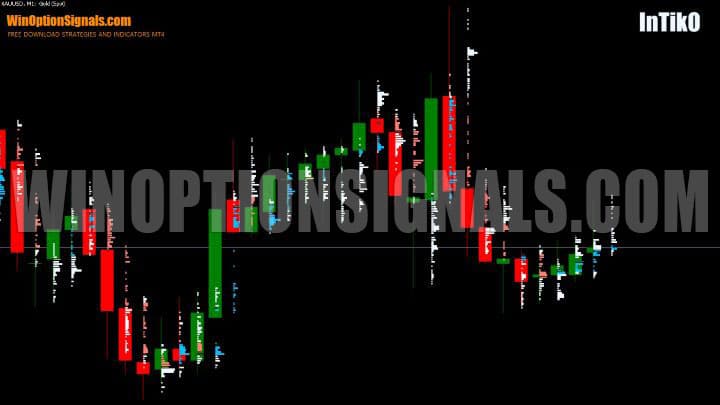
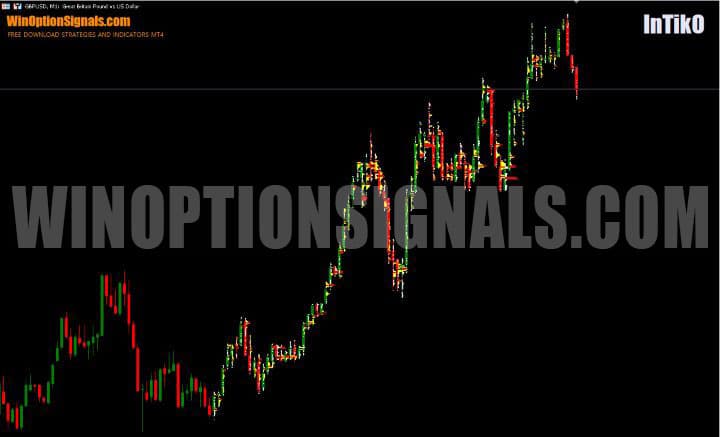
Before adding the InTikO indicator to the chart, you should load the history of the selected asset for all timeframes , starting from M1 and ending with the one on which you plan to trade. If the history has loaded, but volume indicators do not appear on the chart, you can try switching from one timeframe to another, which solves the problem. As a result, you should have a chart like this, where the last candles display the cluster volume:
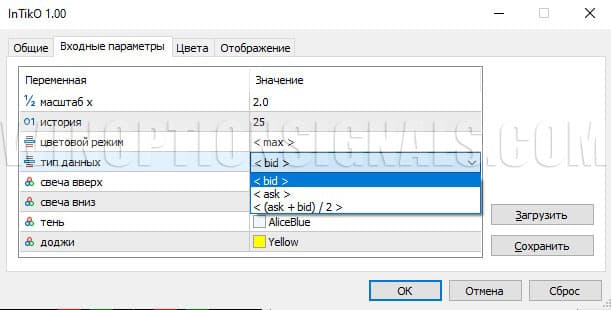
In the indicator settings, you can change the size and color of the clusters, select the data type used and the history depth for loading indicators.
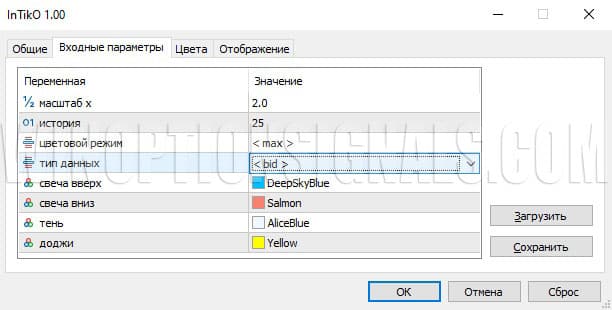
The indicator settings have the following variables:
- Scale x;
- Story;
- Color mode;
- Data type;
- Candle up;
- Candle down;
- Shadow;
- Doji.
The x scale changes the size of the clusters representing tick volume. You can increase the size by setting larger values in this field. The default value of 2.0 makes the indicator values clearly visible on the chart, but at the same time does not interfere with the visibility of bars and candles, so there is no point in changing it.
History is measured in bars. You can set any number, but the indicator takes time to process quotes; too large values can load the PC for some time.
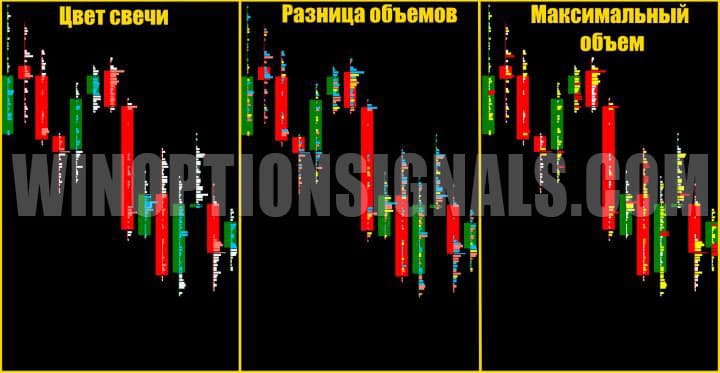
InTikO color mode has three preset options.
The first mode (<candle color>) colors the clusters on the body of the candles depending on their color, and on the shadows of the candles – white.
The second, <volume difference>, supposedly calculates whether those volumes were generated by an upward movement or a downward movement. In this case, the price on each tick is compared with the previous price, and if the previous value was lower, then new clusters are colored blue, and if higher, pink. This is an analogue of delta for cluster analysis, but adapted for quotes from Forex and binary options brokers , where information on the total number of buyers and sellers at each point in time is not provided.
The third option for color mode settings
The data type allows the trader to choose from three options for the type of data used: by bid, by ask or by their average value. Since most platforms and traders use bid values by default, it makes little sense to change this parameter:
The remaining four indicator settings allow you to color the clusters in your own way for the “Candle Color” option.
Trading rules using the tick volume indicator for MT5 inTikO in binary options trading.
In binary options trading, where it is important to quickly assess the price reaction to certain levels, signals or patterns , the tick volume indicator for MT5 can serve as an excellent assistant, but is unlikely to be an independent tool.
First of all, volume makes it easier to trade from support and resistance levels , as well as in strategies that use pullbacks to optimize option purchases in the direction of the trend. We talked more about how to recognize and use flats and trends in the market in a series of materials:
- How does a trend work in markets?
- Identifying and using bullish and bearish trends.
- Market phase changes .
- How to determine a flat in the market?
A large tick volume identifies an intense struggle between buyers and sellers, and the subsequent price movement determines the winner of this struggle. Places where volumes accumulate become unique key points on the chart. They can be used both dynamically, recognizing the intentions of most traders earlier than simple price patterns allow, and after the fact, interpreting large volume as an additional level of support or resistance.
Below we will give several specific examples of the use of volumes in binary options trading. In practice, tick volumes can also be combined with indicators of other indicators and in the use of any other trading systems.

Options for trading strategies using volumes can be:
- Trading from levels formed by volumes.
- Trading a false breakout level with confirmation by volumes.
- Trading a true level breakout with volume confirmation.
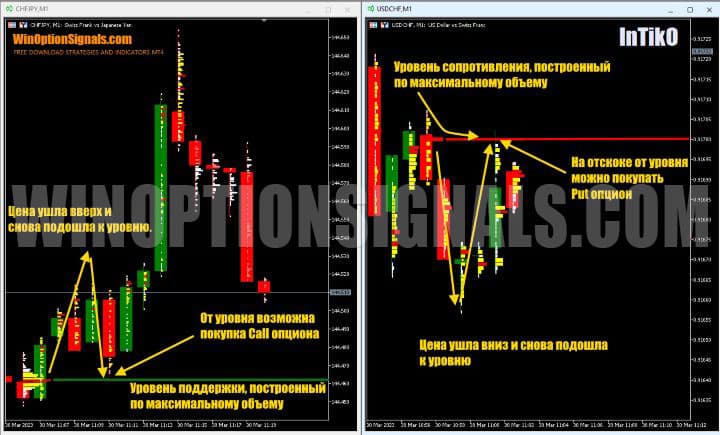
Trading from levels formed by volumes:
To buy a call option:
- The trend is upward.
- A large cluster volume has appeared on the candle, which should be marked with a horizontal level.
- The price moved up from the level.
- The price again approached this level from above.
On a rebound from the level, you can buy a Call option with an expiration of 1-3 candles. Any timeframe can be used.
To buy a Put option:
- The trend is downward.
- A large cluster volume has appeared on the candle, which should be marked with a horizontal level.
- The price went down from the level.
- The price again approached this level from below.
On a rebound from the level, you can buy a Put option with an expiration of 1-3 candles.
This is a simple way to trade by volume, but not the most reliable, since such levels, although they have an impact on the price, will often have insufficient force to reverse it.
Here are examples of his use of levels built by volume to buy Call and Put binary options:
Trading a false breakout level with volume confirmation:
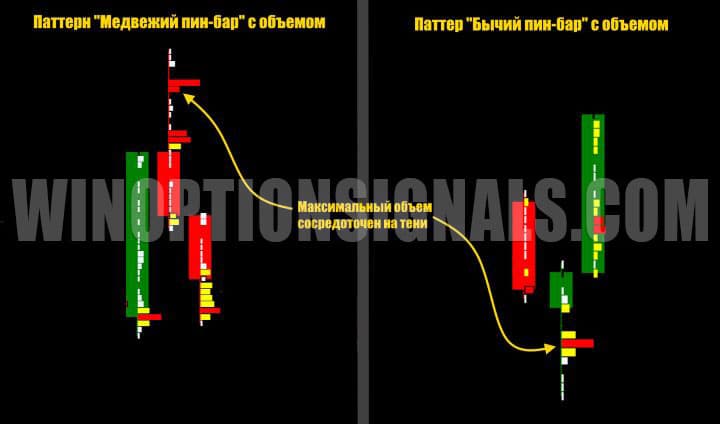
A false breakout of a level is a situation when the price breaks through the level for a short time, but immediately returns and continues to move in the opposite direction. Often a false breakout is traded using a pin bar candlestick pattern . A significant volume on the shadow of the pin bar will confirm that the breakout is false.
To buy a Call option:
- The trend is upward.
- The price approached a strong support level and broke through it downwards.
- A large cluster volume appeared below the level, and the price bounced up, again going above the level.
At this moment, you can buy a Call option with an expiration of 3-5 candles. Any timeframe can be used.
To buy a Put option:
- The trend is downward.
- The price has approached a strong resistance level.
- A large cluster volume formed above the level, and the price bounced down, going below the level.
Below the level you can buy a Put option.
Trading a true level breakout with volume confirmation:
Often, large volumes will appear before a support or resistance level is broken if the intention of the major players is to push the level and allow the price to move further in the direction of the trend.
The true breakout trading rules for buying Call options will be as follows:
- There is an upward trend.
- The price came close to the resistance level.
- Large volumes appeared ahead of the level.
- The price has broken through the level.
In this case, after breaking the level upward, you can buy a Call option with an expiration of 3-5 candles. Any timeframe can be used.
To buy Put options:
- There is a downward trend.
- The price came close to the support level.
- Large volumes appeared ahead of the level.
- The price has broken through the level.
You can buy a Put option.
Opening a Call Option
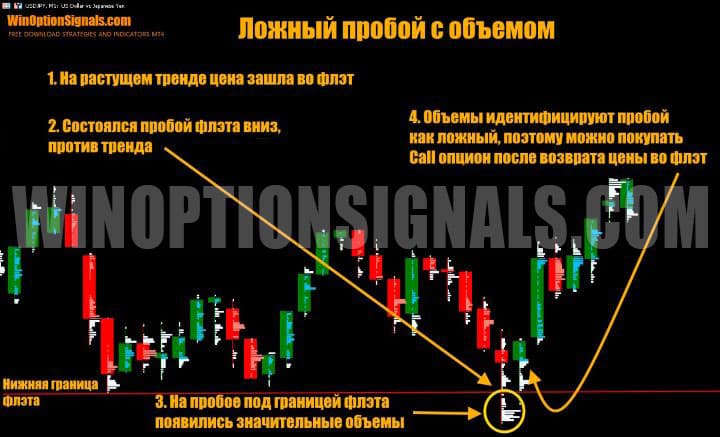
A breakdown of a flat with a sharp increase in tick volumes at the site of the breakdown allows one to recognize the falsity of such a movement and the intention of the price to return to a flat and then continue moving along the trend:
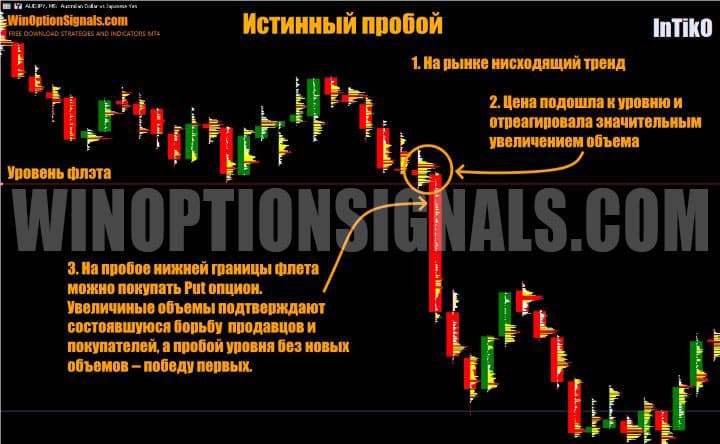
Opening a Put option
In this case, on the next approach of the price to the lower border of the flat, volumes increased sharply, and at the very moment of the breakdown they decreased, allowing the price to freely move further in the direction of the trend. This tells us that the main struggle between sellers and buyers unfolded even before the price left the flat, and further movement only confirmed that the sellers had the upper hand. After waiting for a breakout and making sure that volumes no longer restrain movement along the trend, you can buy a Put option.
Conclusion
Using tick volumes in dynamics is a rather complex task that requires a deep understanding of the principles of technical analysis, working from levels and interpreting volumes. Beginners should carefully read our materials on these topics (links are provided in the article) and practice using tick volumes on a demo account before moving on to real trading.
It should be noted that the tick volume for each candle, which InTikO visualizes, is better suited for interpreting these indicators in dynamics, when the price has just begun a new movement, starting from the volume on a fresh candle.
There are other volume indicators for binary options that build a volume profile over a given time interval. Examples of such indicators for the MT4 platform are VP-V6 and VP Range V6 . They help reflect the previous total trading volume near the level and confirm the significance of such support or resistance, therefore they are better suited for trading from levels on pullbacks.
Remember that trading with the trend and adhering to the rules of risk management and money management greatly increases the profitability of any trading strategy. Trading with a reliable partner, whom you can find in our rating of binary options brokers, can also protect you from losing your deposit.
Free download MT5 InTikO indicator
See also:
How to make money on binary options
How do binary options brokers make money?
To leave a comment, you must register or log in to your account.