Volumes in binary options trading make it possible to more broadly assess the market situation and find the most accurate points for buying options. But for analysis it is not necessary to use only vertical volumes, since they may not always indicate the direction of the market, and therefore a strategy for binary options using cluster analysis may be a more convenient option.
What is cluster analysis for binary options?
At the beginning of the development of stock trading, there were only line charts that displayed the current price without the ability to see highs/lows and open/close. This display was not very convenient and bars replaced linear charts. Bars made it possible to quickly see important price values, but the body and shadows made it even easier and clearer to observe the market after the appearance of candles.
In modern times, new ways of displaying prices have begun to appear, one of which is a cluster chart for binary options, on the basis of which this strategy for binary options was built:
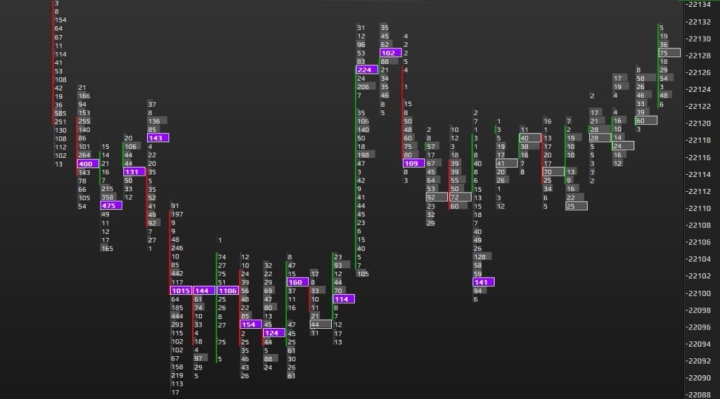
The advantage of this strategy is that it is not necessary to use real volumes, and tick volumes will be quite sufficient.
In itself, a large volume in trading most often indicates the presence of “big players” in the market, which allows you to buy options in the direction of large open positions of the “smart money”.
To determine volume, there are two main ways:
- Vertical volume.
- Horizontal volume.
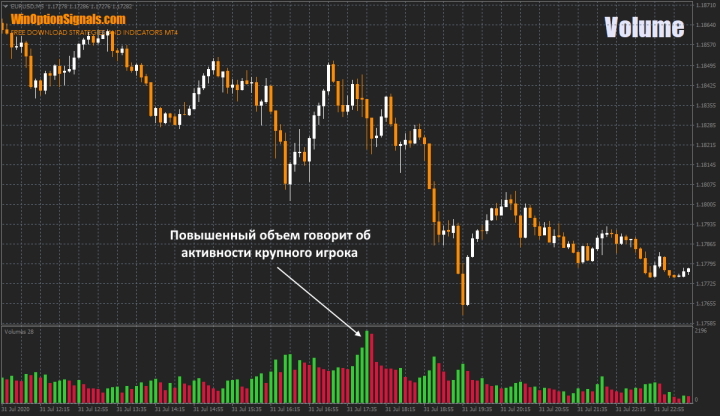
Vertical volume is formed within one candle or bar, and if it is elevated, this indicates that there is a major player in the market. On the chart, such volumes are displayed as a histogram:
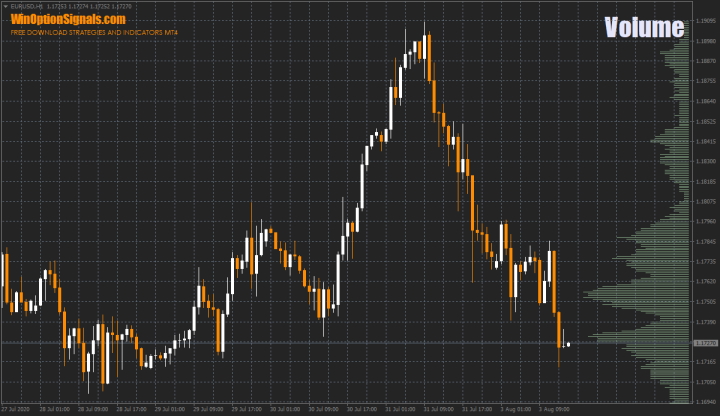
Horizontal volume is no longer formed by time, but by a specific price, which allows you to see important price zones that are of interest not only to the “big player”, but also to ordinary traders. Such zones most often become support and resistance levels. This type of volume looks like this:
A strategy using cluster analysis in binary options trading is a more accurate method than using conventional volumes, as it allows you to see horizontal volume for every minute, hour, day, and so on. Using such a strategy for binary options makes it possible to determine important price levels without third-party indicators for binary options, and such levels will always be supported by the fact of activity on them in the form of traded volume. A regular price display allows you to see a change that has already occurred, while a strategy using cluster analysis for binary options allows you to see the division between buyers and sellers, which in turn provides insight into market sentiment. Therefore, we can say that when a trader studies a cluster, it becomes possible to see the “skeleton” of a candle.
How to Use Cluster Analysis for Binary Options
To start using cluster analysis for binary options and this strategy, you will need to download and install special indicators for the MetaTrader 4 trading terminal:
The first indicator allows you to build a volume profile (clusters) for different periods of time, and the second one builds a general volume profile, for example, for a week or a month.
It is worth noting that although these indicators have the ability to build clusters for binary options based on real volume, tick indicators will still be used, since Forex brokers or binary options brokers do not have the ability to provide real volumes.
VP V6 indicator and cluster analysis for binary options
The VP V6 indicator builds clusters and volume profiles for specified time periods. For example, you can use daily clusters for an hourly chart:
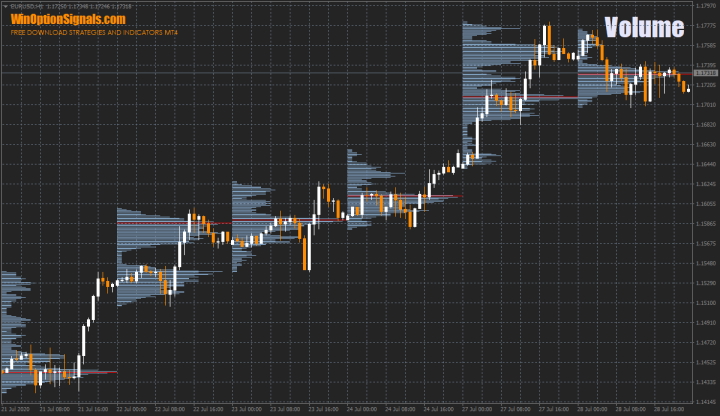
This construction allows you to see important price levels that were formed during the day, and exactly the same clusters can be viewed on any time frame. In the image below, the EUR/USD currency pair and the M15 chart, where the flat formed at the top was supported by volumetric accumulation:
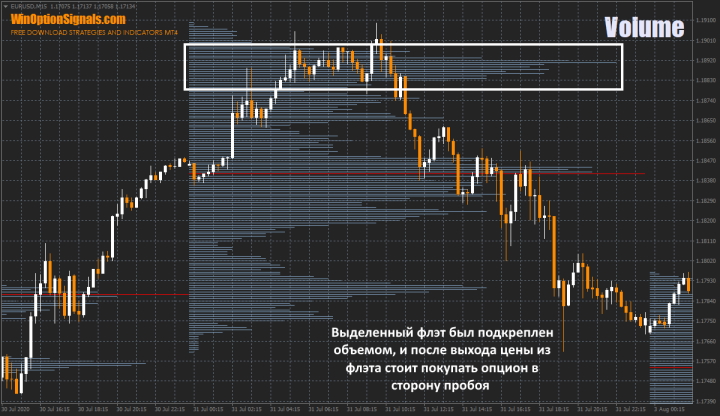
And after the breakout of such a flat, it is worth buying a Put option.
Also, this approach does not prohibit the addition of other indicators that can help make trading decisions. If you take the same area and add the MACD indicator, you can see how at the moment of the breakout of the flat it also signaled the purchase of a Put option:
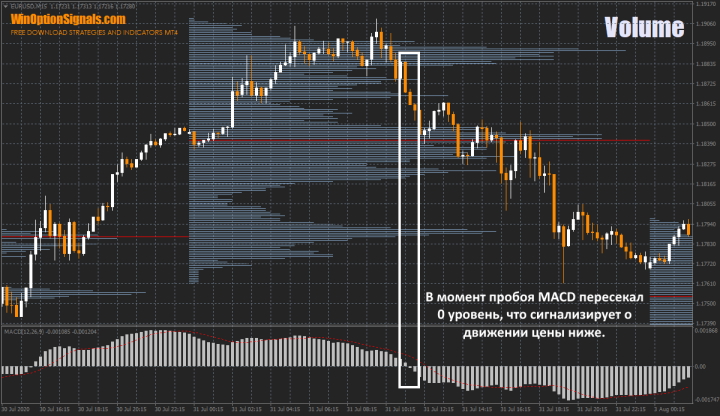
You can also use small time frames to determine short-term levels for quick trades. The principle of analysis does not change, but before using charts M1 and M5, you should definitely test this approach on a demo account, since turbo options can very quickly deprive a trader of accumulated profit or deposit.
VP Range indicator and cluster analysis for binary options
You can also use a general market profile instead of individual clusters. Such a profile is built over a long period of time (week, month), after which a similar analysis is carried out.
In the image below you can see the market profile for one trading week. After the price exited the flat (where there was also volume and it was worth considering buying a Call option), the price corrected and pushed off exactly from the level of the largest volume:
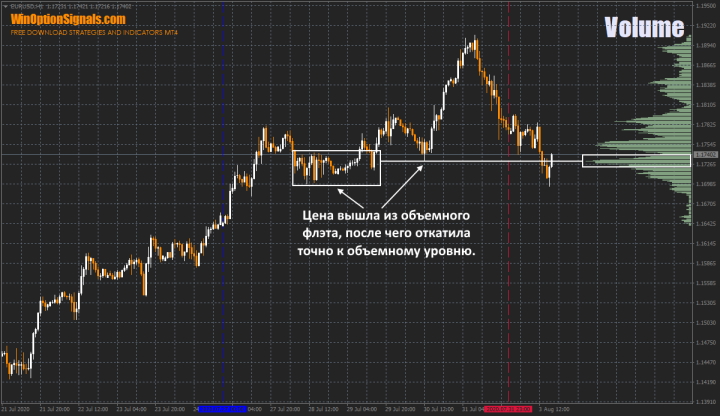
When the price approaches such levels, there is always a very high probability that the price will “bounce” from the level, which is what happened in this case. At this point it was also worth buying a Call option.
Trading platforms for cluster analysis of binary options
At the moment, there are many different platforms for volume analysis:
- TradingView .
- Ninja Trader.
- Volfix.
- ATAS
- SB Pro.
But all of these platforms are paid and are not suitable for beginners in binary options trading due to their price, as well as the complexity of setup. Therefore, at first, you can easily use free analogues that work on tick volumes, since even they allow you to start making a profit from trading binary options.
Also, each of the platforms provides free demo access, which will allow you to understand whether such platforms are suitable for the trader.
Conclusion
A strategy based on cluster analysis for binary options allows you to determine both important price zones and see which side is winning at the moment (bulls or bears). This information can be used in binary options trading, complementing the analysis with other indicators or adding volume indicators to a ready-made trading system.
The main thing to remember is that any trading strategy for binary options requires verification and testing, and during trading you should never forget about money management and risk management .
See also:
How to choose a binary options broker?


To leave a comment, you must register or log in to your account.