
Among all types of analysis in binary options trading, we can distinguish both simple ones, which are suitable for beginners, and complex ones, which only experienced traders can understand. One of the simple types of analysis can be considered graphical analysis of binary options.
This type of analysis involves trading on clean charts without the use of complex indicators, and the figures of graphical analysis of binary options are most often constructed using several slanted or straight lines.
It is also worth noting that with the help of graphical analysis of binary options you can trade on any markets and any time frames , since this type of analysis is universal. In addition to trading using graphical figures, graphical analysis includes candlestick analysis and Price Action .

Binary options graphical analysis figures
There are quite a lot of figures for graphical analysis of binary options, but the most frequently used figures can be identified:
- Triangle.
- Rectangle (flat).
- Head and shoulders.
- Double top/bottom.
- Flag (pennant).
Next, we will take a closer look at each of these figures and examples of binary options trading using graphical analysis.
Note: before you start studying the figures, it is worth remembering that despite the fact that all the figures are different, they are traded according to the same principle. The essence of the principle is that after the figure breaks through in the desired direction, it is necessary to wait for the price to roll back to the broken level, and then make a binary options transaction. Of course, you can use more aggressive methods and buy options at the time of the breakout, but this approach can lead to frequent losses, since it is not known whether the breakout will be true or false. More visual examples of making transactions when trading using graphical analysis of binary options can be seen below.
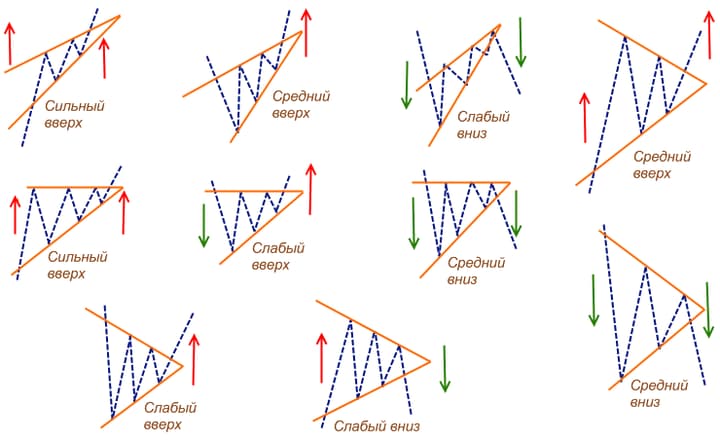
Triangle in binary options
The triangle is considered one of the simplest and most common figures in the graphical analysis of binary options, and this figure has different types:
- Equilateral triangle.
- Ascending triangle.
- Descending triangle.
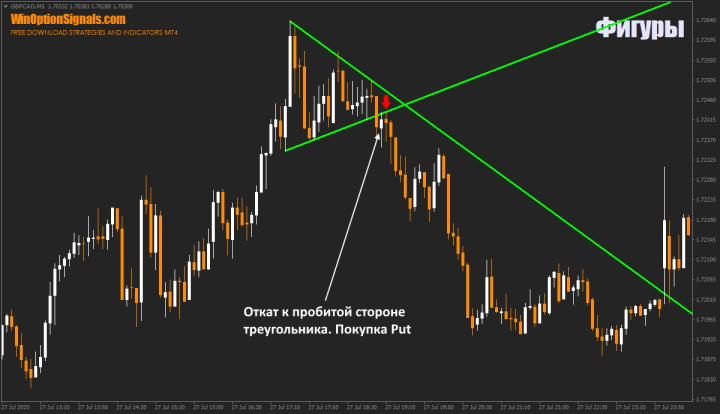
Equilateral triangle in binary options
Such a triangle is formed by two converging lines, which are located at the same angle relative to each other.
This type of triangle is most often a trend continuation figure and appears during price corrections, but it can also be a reversal figure, and when trading an equilateral triangle, options are bought at the moment of a rollback to the broken side of the figure:
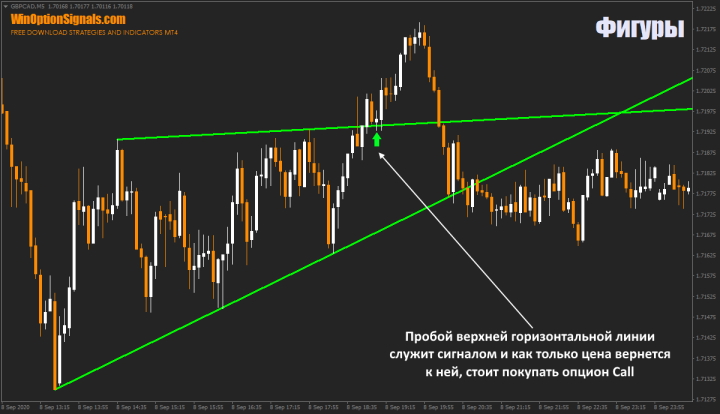
Ascending triangle in binary options
An ascending triangle is also formed by two lines, but one of them is horizontal (resistance, but small deviations are possible), and the second is ascending. This type of triangle is almost always a growth pattern or a continuation of an uptrend. Trading is carried out after a breakout and rollback to the upper horizontal line:
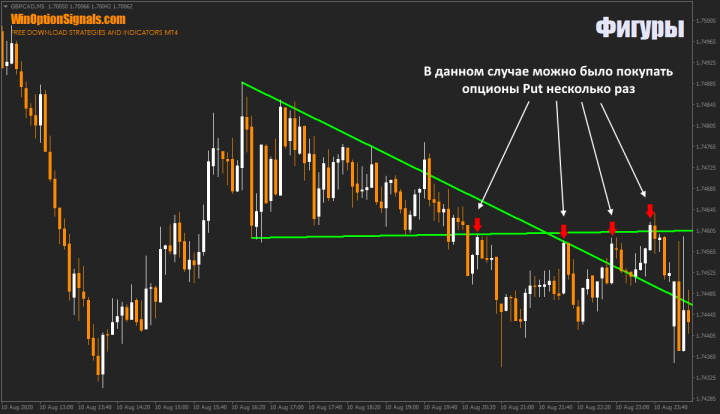
Descending triangle in binary options
This figure is exactly the same, but inverted, and will almost always form during a downward trend or when the market turns downward. Trading in this case is also carried out at the moment of breakdown and subsequent rollback to support (horizontal line of the triangle):
Rectangle in binary options
A rectangle is the same flat or sideways trend , which is built using two horizontal levels, and it can be either bullish or bearish.
Also, this figure can be a reversal, but this can only be known by the fact that the rectangle has broken through in the opposite direction.
Bullish rectangle in binary options
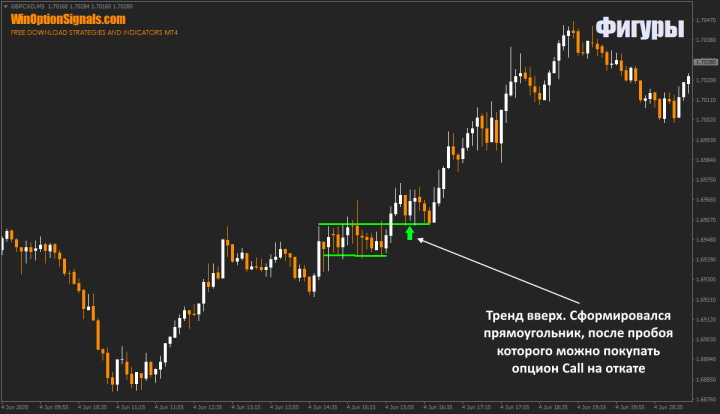
A bullish rectangle is formed during an uptrend and is a figure of continued growth, and such a rectangle is the easiest to trade and the principle in this case does not change, so you need to wait for a rollback to the broken border, and then buy an option:
Bearish rectangle in binary options
The bearish rectangle, as has already become clear, is a continuation figure of a downward trend, also having a support and resistance level. Trading is carried out in exactly the same way, but the price must break through the lower level, and then roll back:
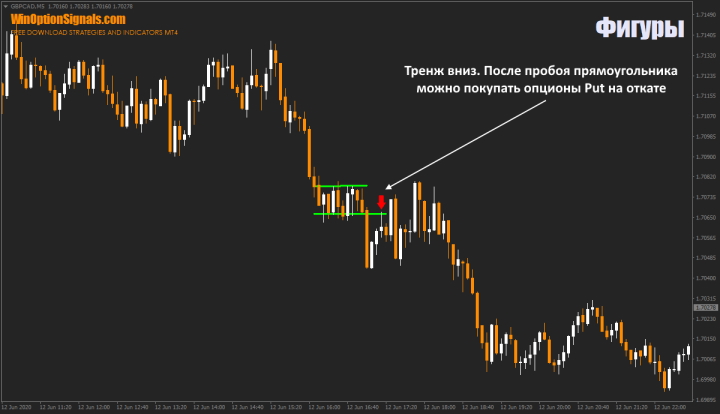
Also note that despite the fact that the price returned to the upper border after the breakout, then it still continued its movement downwards, so moments of deep rollbacks are often possible.
Head and Shoulders in Binary Options
Almost all traders know about this graphical analysis figure and that is why it is the most popular figure in the technical analysis of binary options .
There are two types of this figure:
- Standard head and shoulders.
- Inverted head and shoulders.
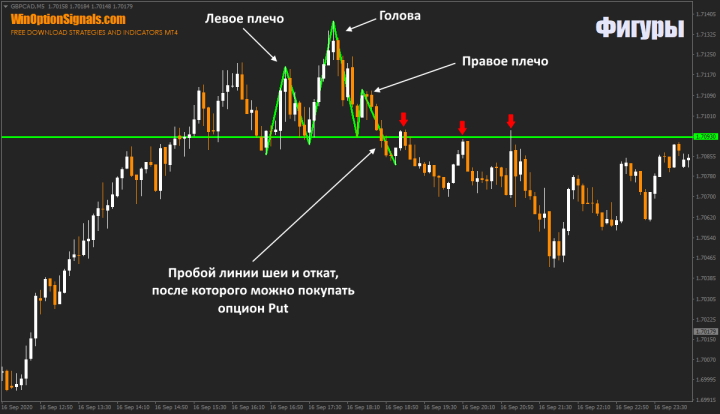
A figure is considered formed only when all three of its components have been constructed:
- Left shoulder.
- Head.
- Right shoulder.
And at the same time, a mandatory condition is a breakdown of the neck line of this figure and a subsequent rollback to the broken border.
The mistake of novice traders is to trade this pattern at the moment of the breakout itself, but this pattern can also have several subsequent shoulders, and therefore you should always wait for a full breakout:
Inverted Head and Shoulders in Binary Options
An inverted head and shoulders formation occurs when the market turns and most often occurs at low points. The figure itself is no different from a standard head with shoulders, but note that the neck line can be not only straight, but also inclined:
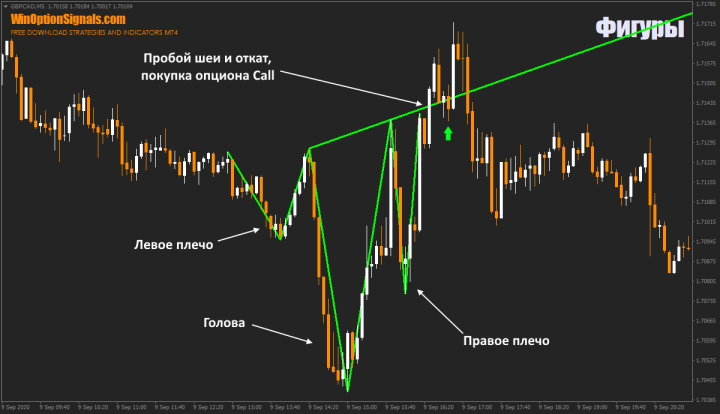
Options are also bought after the neck line is broken on a pullback.
Double top and double bottom in binary options
A double top/bottom most often forms at market extremes and indicates a possible reversal, but for this pattern to be considered formed, a breakdown of the lower or upper boundary must necessarily occur. If trades are made on a breakout, then there is a high probability of incurring a loss, since the formation of another figure may begin - a triple top/bottom. Also, in addition to the formation of a triple top/bottom, a prolonged flat may begin to form, which will also bring losses when trading at the border.
Double top in binary options
A double top is most often formed at a reversal in an uptrend , although there may be exceptions when the pattern is formed by movement. After the formation, as mentioned above, you should wait for the breakdown of the lower border, and then make a trade on the rollback:
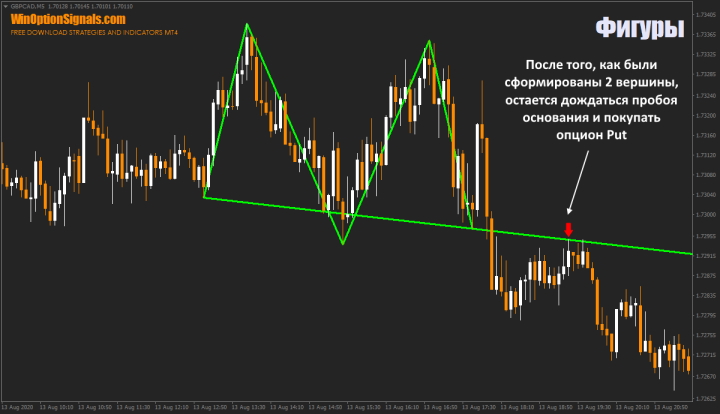
It is also worth noting that this figure may not be formed very ideally and there may be attempts to build a third top, as in the image above, where you can see an attempt to form a third top on the right.
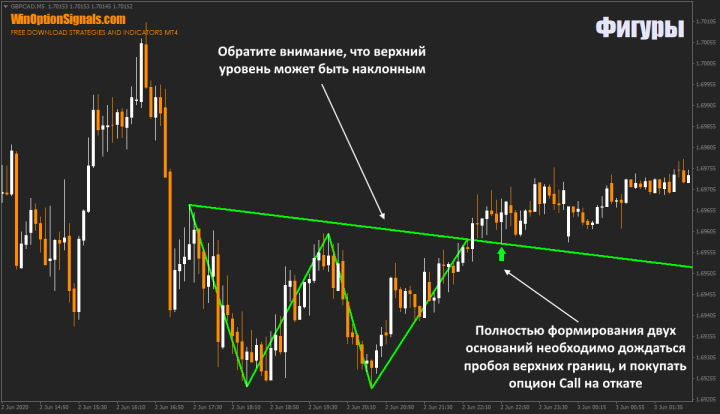
Double bottom in binary options
A double bottom most often appears at the bottom of the market and indicates a reversal, but, as in the first example, a breakdown of the upper boundary is mandatory in this case, after which you can expect a rollback and buy an option:
Flag in binary options
The flag is a trend continuation figure and can actually appear very often even in small movements, but its essence is always the same - price correction.
The distinctive characteristic of a flag is its shape - a slanted small channel resembling a flag, and there are both bullish and bearish flags.
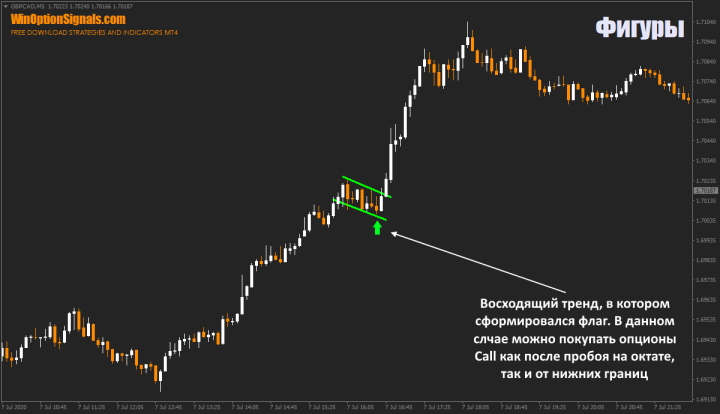
Bullish flag in binary options
The bullish flag, unlike many figures in the graphical analysis of binary options, can be traded not only after a breakout, but also when the price approaches the lower border, but it is worth understanding that trading without a breakout is more risky, since it is not known how long the formation of the flag will continue, but with a strong trend, most often the flag consists of about ten candles:
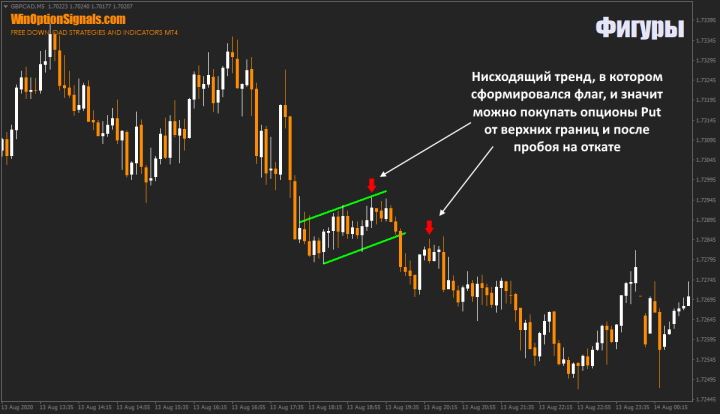
Bear flag in binary options
The bear flag serves as a continuation figure for a downward movement and can also appear very often even on small movements, but it is traded in the same way:
Indicators of graphical analysis patterns
For those traders who have difficulty finding and constructing patterns on their own, you can use various indicators that can be found both online and on our website. The Price Patterns indicator is one such indicator. But it is worth noting that no indicator will build patterns better than the trader himself, so it is very advisable in the future to study all the patterns, as this will make it possible to trade anywhere and at any time, even using a smartphone.
Graphic analysis of binary options: tips for beginners
Of course, the above examples of patterns are not the only ones in the graphical analysis of binary options and there are quite a lot of different patterns, including different types of flags, triangles and other figures that are both complex and simple. All simple and complex existing figures of graphical analysis of binary options are described in the book by Eric Nayman - “The Small Encyclopedia of a Trader” . In addition, the author describes the principles of pattern trading and gives a lot of advice, backing everything up with drawings and graphs.
Also, to fully understand trading using graphical analysis of binary options without using strategies and indicators for binary options, it is worth understanding:
- What is a trend and how to determine it .
- What are trend phases ?
- What are the differences between a bullish and bearish trend .
And after studying all the material, you should definitely consolidate your knowledge on a demo account , and only after that move on to a real account.
Conclusion
In conclusion, I would like to say that trading binary options can easily bring profit without using indicators, since there is such a type of analysis as graphical, and its full understanding will allow you to predict absolutely any market and any time frame.
But do not forget that graphical analysis of binary options is a universal trading approach, which means this method can complement any trading systems or strategies and be used in conjunction with other tools.
See also:
How to choose a binary options broker?
To leave a comment, you must register or log in to your account.