When discussing technical analysis, one cannot fail to mention levels. They are the basis of many classic and new figures, with the help of which traders try to find patterns in the price movement of a particular asset.
There is an opinion that levels cannot be adapted for binary options trading, but in fact this is not the case. The main thing is to use the right approach. Below we will consider support/resistance levels as a unique tool. We will also highlight the main advantages and disadvantages of their use and find out how you can make a profit by trading binary options based on the signals received.
Concept of support and resistance levels
Support/resistance levels are certain psychological barriers that can only be overcome the first time with the help of a strong impulse. In some sources you can also find the concept of “key levels”. In principle, they are the same thing.
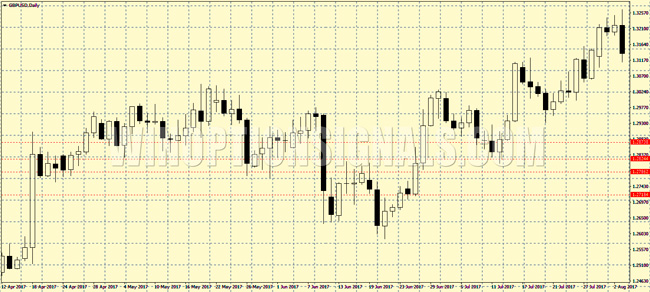
Therefore, in order to find such a level on the asset price chart, you need to see several rebounds from some imaginary line. The most common sign of a rebound is candles that have large candles in the area of extremes. The more such “confirmations” you see, the stronger the level’s meaning.
This method is one of the simplest, but has some disadvantages. Very often, inexperienced traders draw levels not only where they are needed, but also where they are not observed. To some extent, plotting graphical images on a chart is very useful, but it does not affect the success of trading in any way. For this reason, in the first couple of days it is necessary to concentrate attention on the key zones, and only then proceeds to finding the levels. The actions are performed in approximately the same order. First of all, you need to plot all visible levels on the chart.
The result will be a cluster of lines. Let's outline it. This will be the support/resistance zone. Let's call it a buffer. If the price enters it, it will be a signal not to take any action, since in this case we cannot determine the further direction of the price movement. This marking makes it possible to relegate the trader’s inexperience to the background and reduce the number of false signals that appear in the event of incorrect marking of levels. Trading support/resistance zones works a little differently compared to traditional levels. We will describe the nuances below.
Trading strategy for binary options
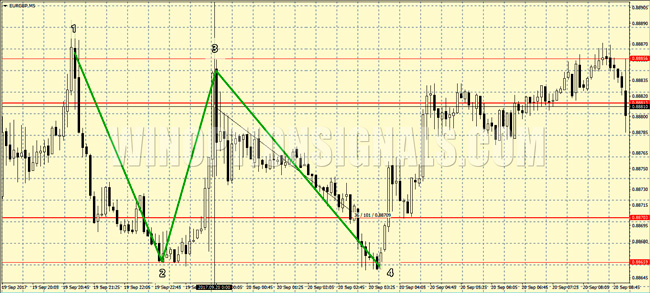
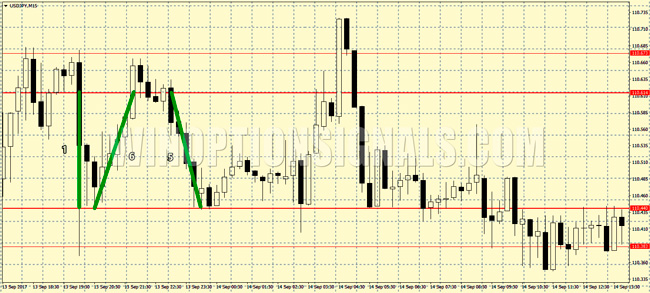
It is based on working with a price channel, which is determined by 3-4 extreme points. The obtained data is used to identify extreme support/resistance zones. In other words, the channel will be divided into two: external and internal. We will work specifically with the internal channel. It is recommended to use a small time frame. Fans of intraday trading can choose M5 or M15.
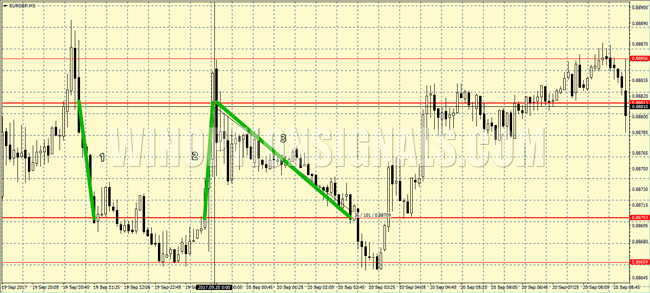
As a result, we will have 4 anchor points. Waves 1-2, 2-3 and 3-4 are formed on the chart. At the next stage, the trader needs to understand how many candles are required for the price to go all the way from one border to the opposite one. Further it will be clear for what purpose this is done.
The average number of candles is taken. The trader needs to add up the number of candles and divide by the number of waves (5+3+36): 3=15. Therefore, 15 candles will be the optimal expiration time for working with a specific channel.
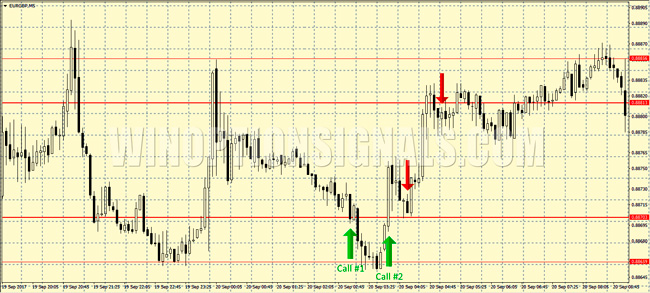
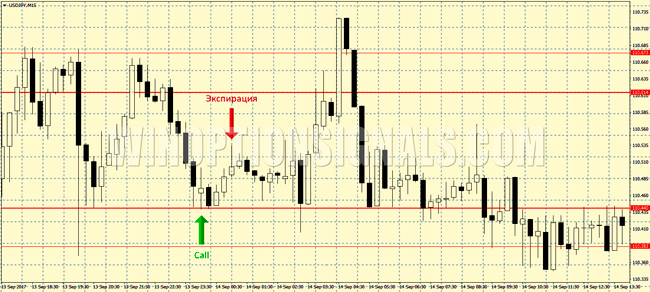
Naturally, you should buy an option when there is a rebound from the channel border. When the price touches the lower level, you must wait for confirmation in the form of a closed candle above it. This is a clear signal to open a CALL option. The expiration date is 15 candles of the timeframe used. If the price has broken through the border and continued to decline, then it is recommended to open a safety transaction for the same amount the moment it next touches the same border. TF also has 15 candles.
The advantage of BO is that the price of the asset should be only slightly higher at the end of expiration than at the time the transaction was opened. Since the average value of the channel is used, the probability of making a profit on both options will be quite high. As another example, consider the M15 chart of the USDJPY currency pair. This channel is a night channel, so the price fluctuation is not that big. The average number of candles is 4. This value is obtained based on the addition of the three previous waves.
You need to buy an option when the price touches the channel border and the candle closes above it. For TF M15, the expiration period in the example under consideration will be 1 hour. Touching it again is a signal to open another trade. The PUT option is purchased when the upper level is touched.
Conclusion
Beginners are advised to trade during the Asian trading session . With low volatility, the probability of the price rebounding from the level is much higher, which indicates a high degree of market predictability. It is easier for a trader to determine the required expiration date based on the number of candles in the waves. If the price is outside the channel, then it is better not to enter the market. In this case, you need to change the timeframe, asset, or adjust the channel itself.
Strategy "Lines of support and resistance"Trend lines help determine the direction of movement and the corridor in which the price fluctuates. |
Line Break StrategyThe essence of the strategy is to catch the movement at the moment when the price overcomes support or resistance levels. |
Line Bounce StrategyThe goal of this strategy is to catch the moment when the price cannot break through the support or resistance lines. |
Can't figure out how this strategy or indicator works? Write about it in the comments to this article, and also subscribe to our YouTube channel WinOptionCrypto , where we will definitely answer all your questions in the video.



To leave a comment, you must register or log in to your account.