
It is not uncommon for all binary options traders (even experienced ones) to experience situations where, when opening a transaction, the price suddenly turns around and goes in the other direction, bringing a loss. To avoid such situations as much as possible, there are many ways, one of which is indicators of support and resistance levels. Such indicators automatically place on the chart levels or zones that are most likely to be worked out by the price in the future (that is, the price will bounce off such levels). In this article we will consider everything related to such levels.

Content:
- What are support and resistance levels and why do they work?
- Why use indicators of support and resistance levels?
- How to trade binary options using support and resistance levels?
- Types of support and resistance levels.
- Supply and Demand indicator.
- SS Support and Resistance indicator.
- KG Support and Resistance indicator.
- MTF Resistance and Support indicator.
- Zone indicator.
- Power Dynamite Areas indicator.
- PZ Pivot Points indicator.
- Murray Math indicator.
- Fibo Machine PRO indicator.
- Conclusion.
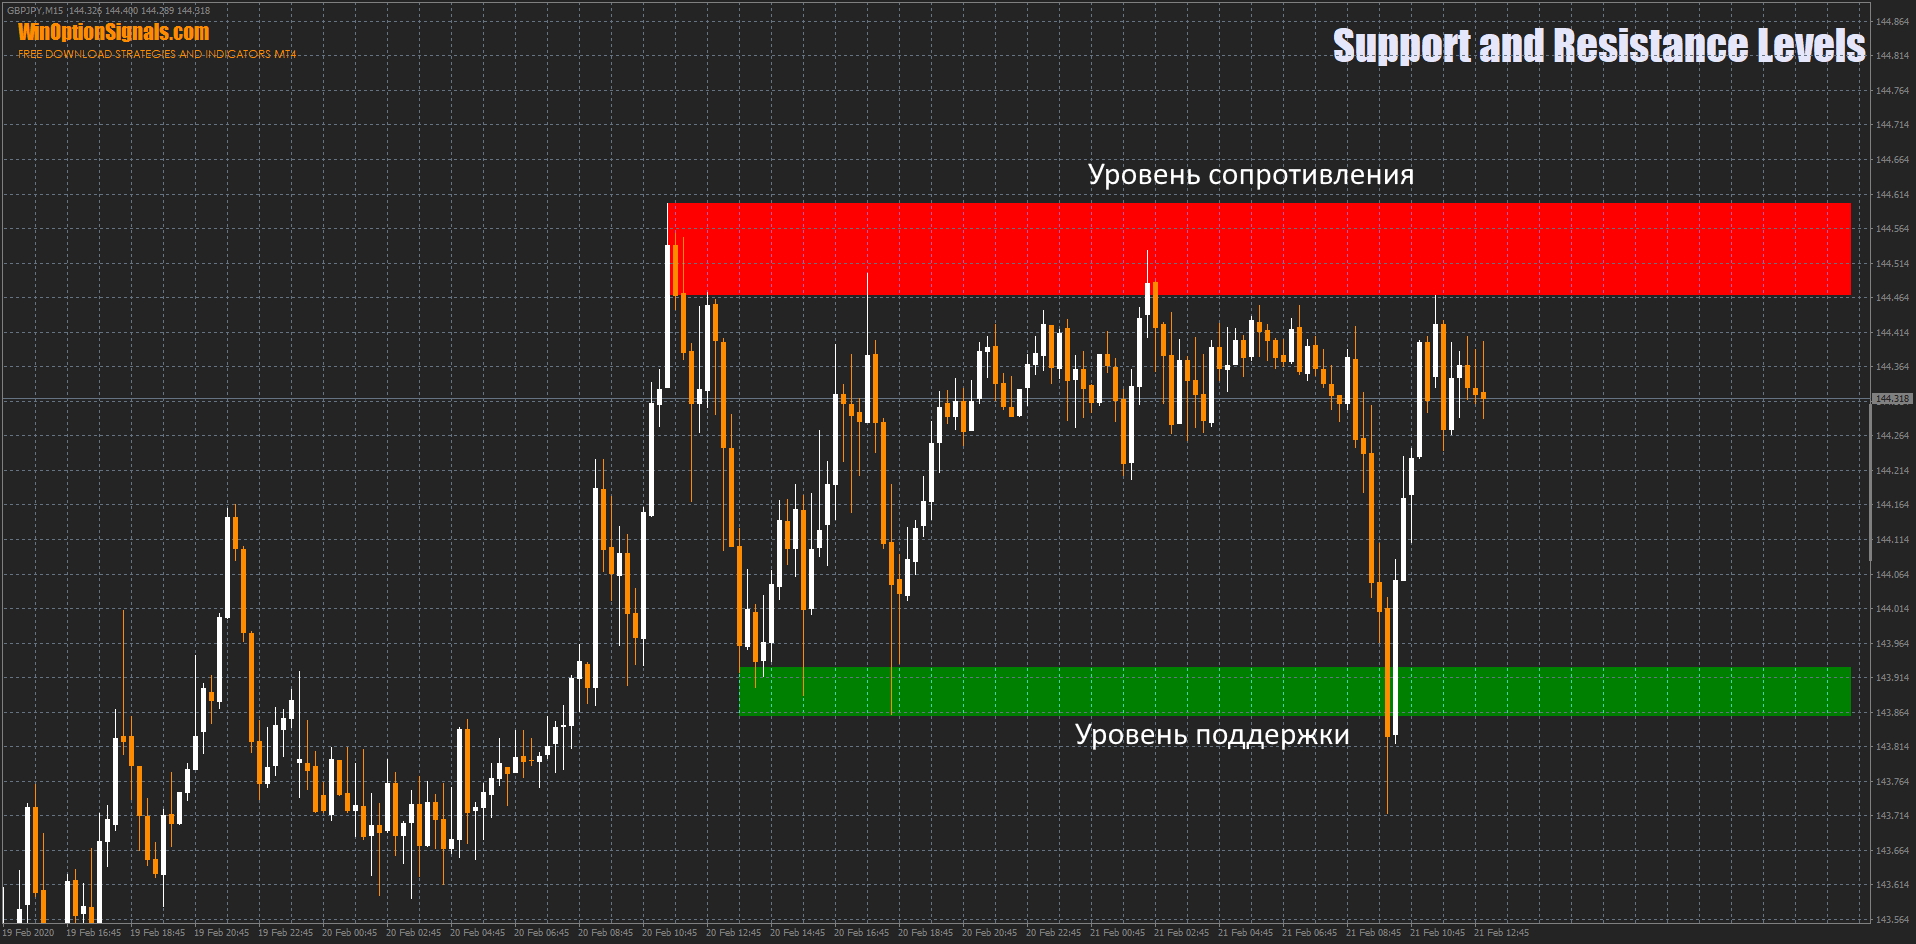
What are support and resistance levels and why do they work?
In simple terms, support or resistance is considered to be the price level that in the future has the maximum opportunity to stop the growth or fall of a trading asset.
As you can see in the picture below, in those places marked on the chart, the price will most likely stop and there will be a reversal:
It is not easy for such levels of support and resistance to arise. There are several reasons why levels work in any market and on any trading asset:
- Many traders placed their limit orders at this price level.
- The so-called “big players” (banks, hedge funds, etc.) keep the price at some level.
- There are no people willing to buy at the resistance level or sell at the support level.
Why use indicators of support and resistance levels?
Determining the levels and zones at which the price will reverse is not difficult, but for beginners it can be a challenge at first, and therefore using indicators of support and resistance levels will be useful for a number of reasons:
- You can compare your levels with the indicator levels and understand how much you made a mistake.
- Using indicators of support and resistance levels saves time and effort spent searching for price zones.
- The Pivot Daily and ATR level building indicators do not make mistakes in their calculations, which cannot be said about people in general.
- Some indicators have sound alerts, using which you do not need to be near the computer all the time.
How to trade binary options using support and resistance levels?
Trading binary options using support and resistance levels can bring good profits, but for this to happen consistently, you need to understand how and when to enter trades. Here are a few basic rules to follow:
- You should enter a trade when the price has reached a support or resistance level. But there are exceptions when the price may not reach the 5-10 point zone and still reverse. If you are a beginner, then it is best to wait until the price reaches the level.
- You should not enter into a trade the first time the price touches the level. It would be more correct to wait until the candle closes and see how the price behaves next.
- It is better to select expiration depending on the time frame used.
- Trading from levels may seem easy, but you should never overestimate the risks and enter into a trade with your entire deposit.
Types of support and resistance levels
All over the world and in all markets, traders use support and resistance levels. There are different types of such levels, and here are the most popular:
- Support and resistance levels based on extremes.
- Support and resistance levels based on Pivot Daily Levels.
- Support and resistance levels based on supply and demand.
- Support and resistance levels based on Fibonacci levels.
There are many types of levels and as many indicators that are used to build them. We have prepared a number of the most useful and functional level indicators that even a novice binary options trader can easily use.
Supply and Demand indicator
The supply and demand zone indicator is popular with more experienced binary options traders who have experience working with different markets. This indicator marks levels at price extremes, which will work out very well in the future.
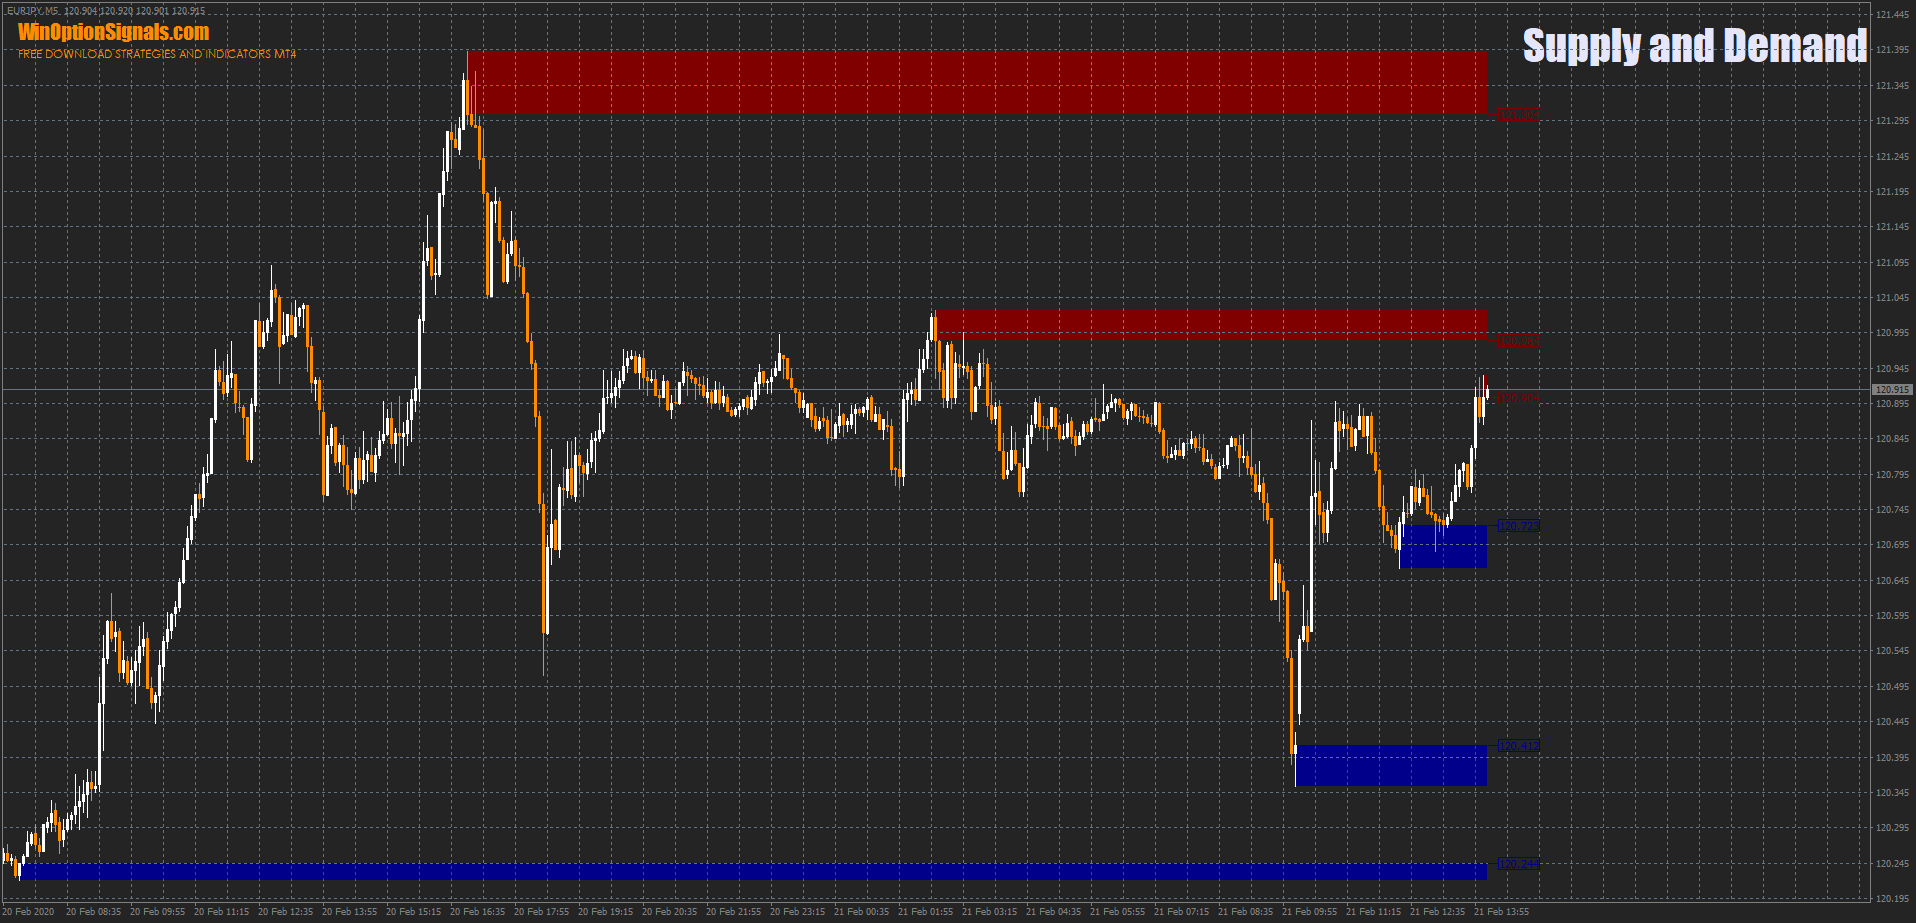
When using the indicator, you can configure:
- Colors of supply/demand zones.
- Removing zones when their price breaks through.
- The time range for which the zones will be built.
- Price marks next to the zones.
Download the Supply and Demand indicator
SS Support and Resistance indicator
This indicator is very similar to the previous one, but it has many more settings, which makes it more flexible. In addition, it contains text notes that will tell the trader how strong or weak a given level is.
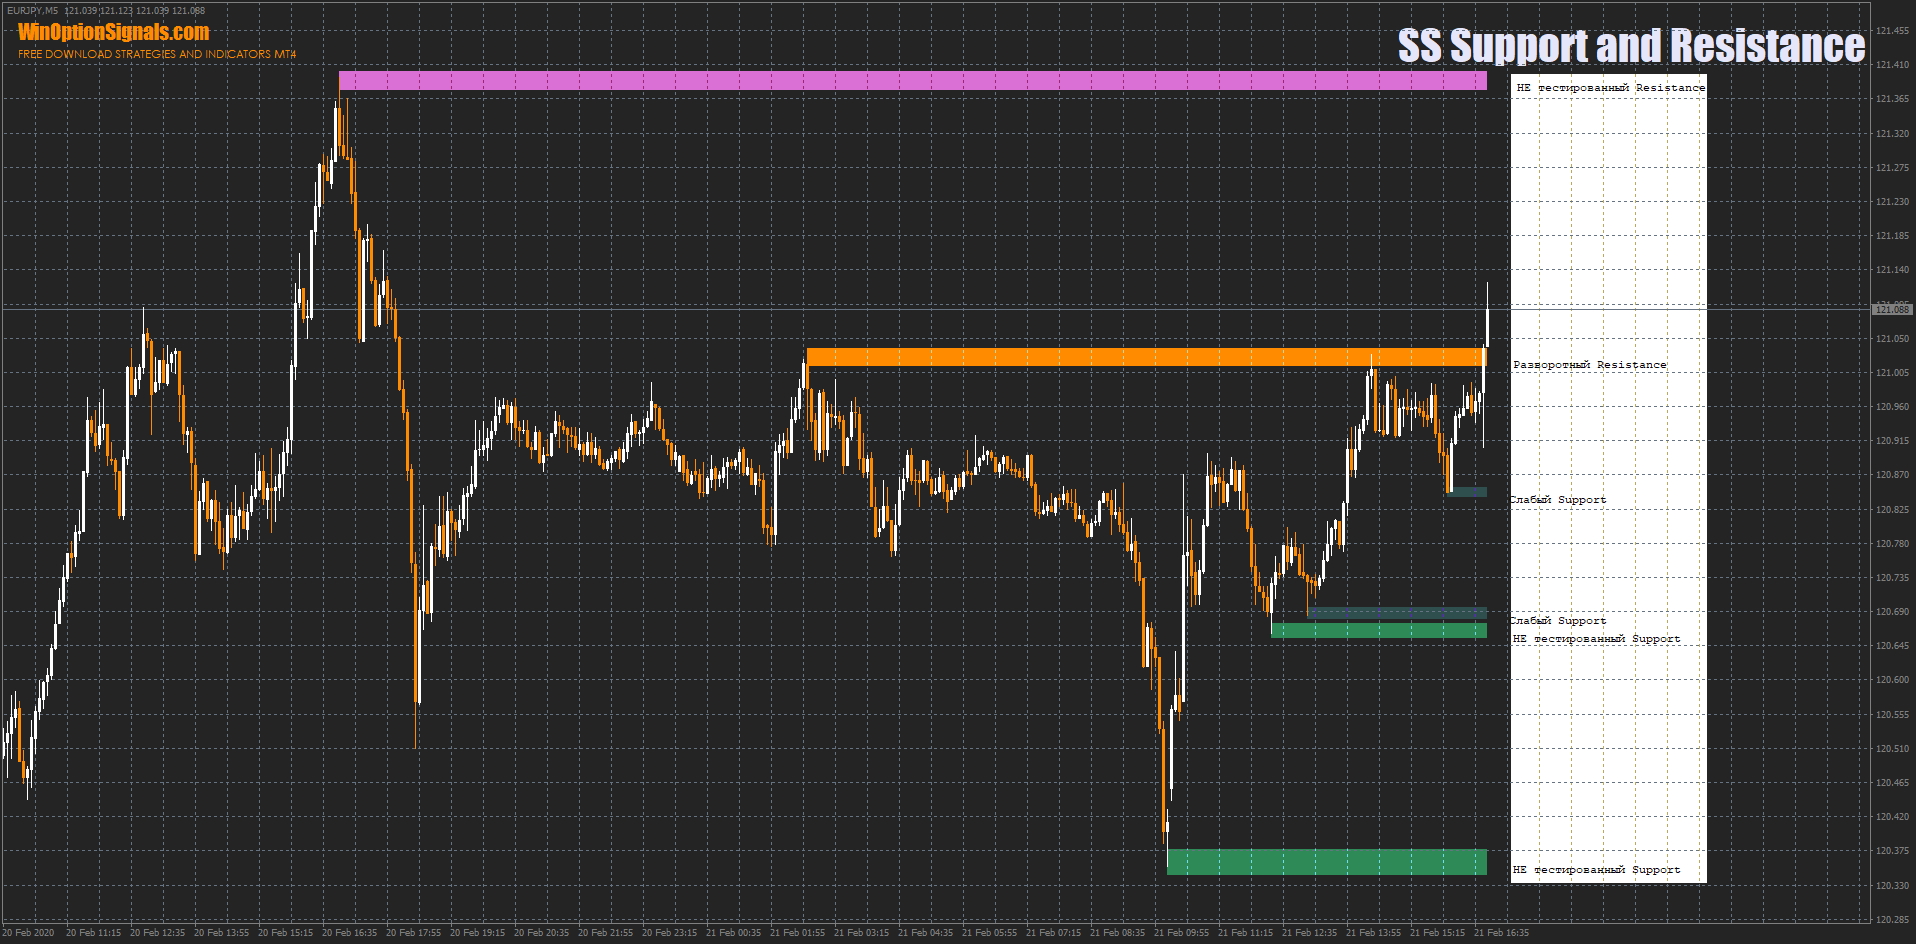
You can configure:
- The maximum number of bars for building levels.
- The time frame on which the levels will be built.
- Colors of zones, which are divided into weak and strong (ten types of zones).
- Width of levels.
- Information about levels (weak, strong, broken, etc.).
- Sound alerts indicating when the price touches a level.
Download the SS Support and Resistance indicator
KG Support and Resistance indicator
This indicator plots support and resistance levels at all extreme points, both primary and secondary. The strength of the levels differs by colors and line lengths. Yellow levels are considered the weakest, and red levels are considered the strongest. This indicator is suitable for fans of scalping, as it marks all possible levels.
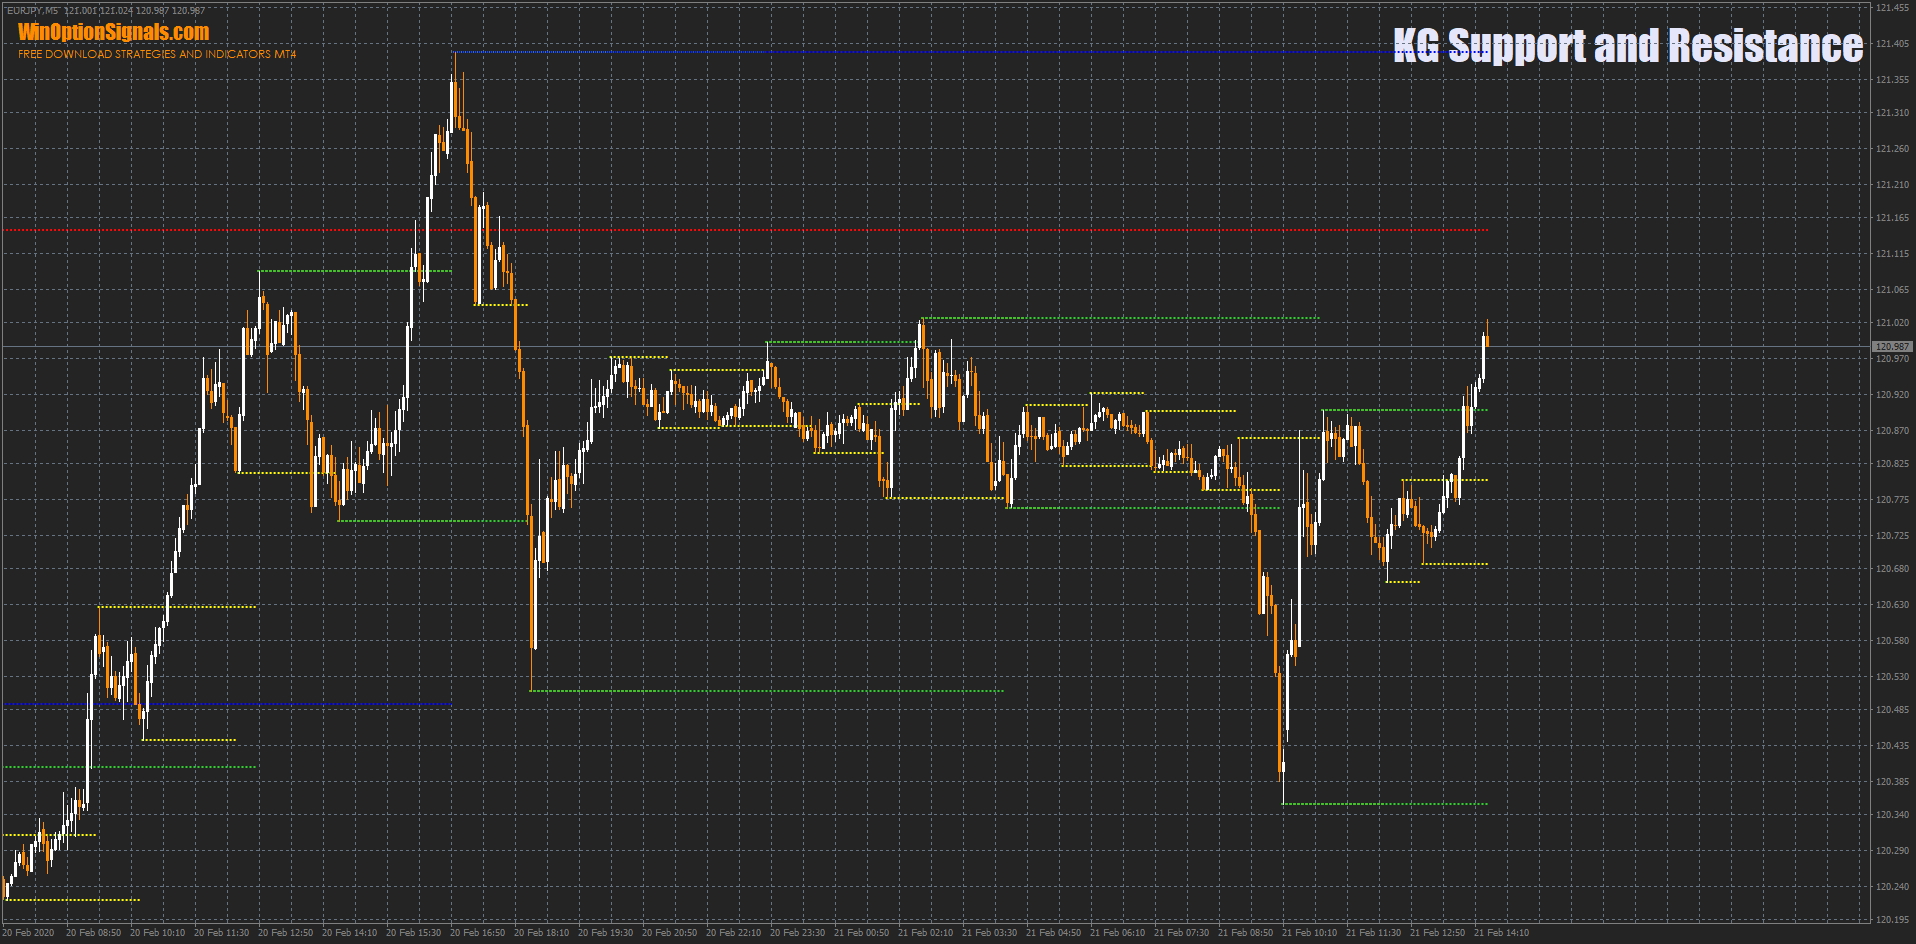
In the settings of this indicator, you can only change the colors.
Download the KG Support and Resistance indicator
MTF Resistance and Support indicator
The difference between this indicator and the previous one is that it can build levels across three time frames simultaneously, which makes the analysis more in-depth. The algorithm for constructing levels is the same.
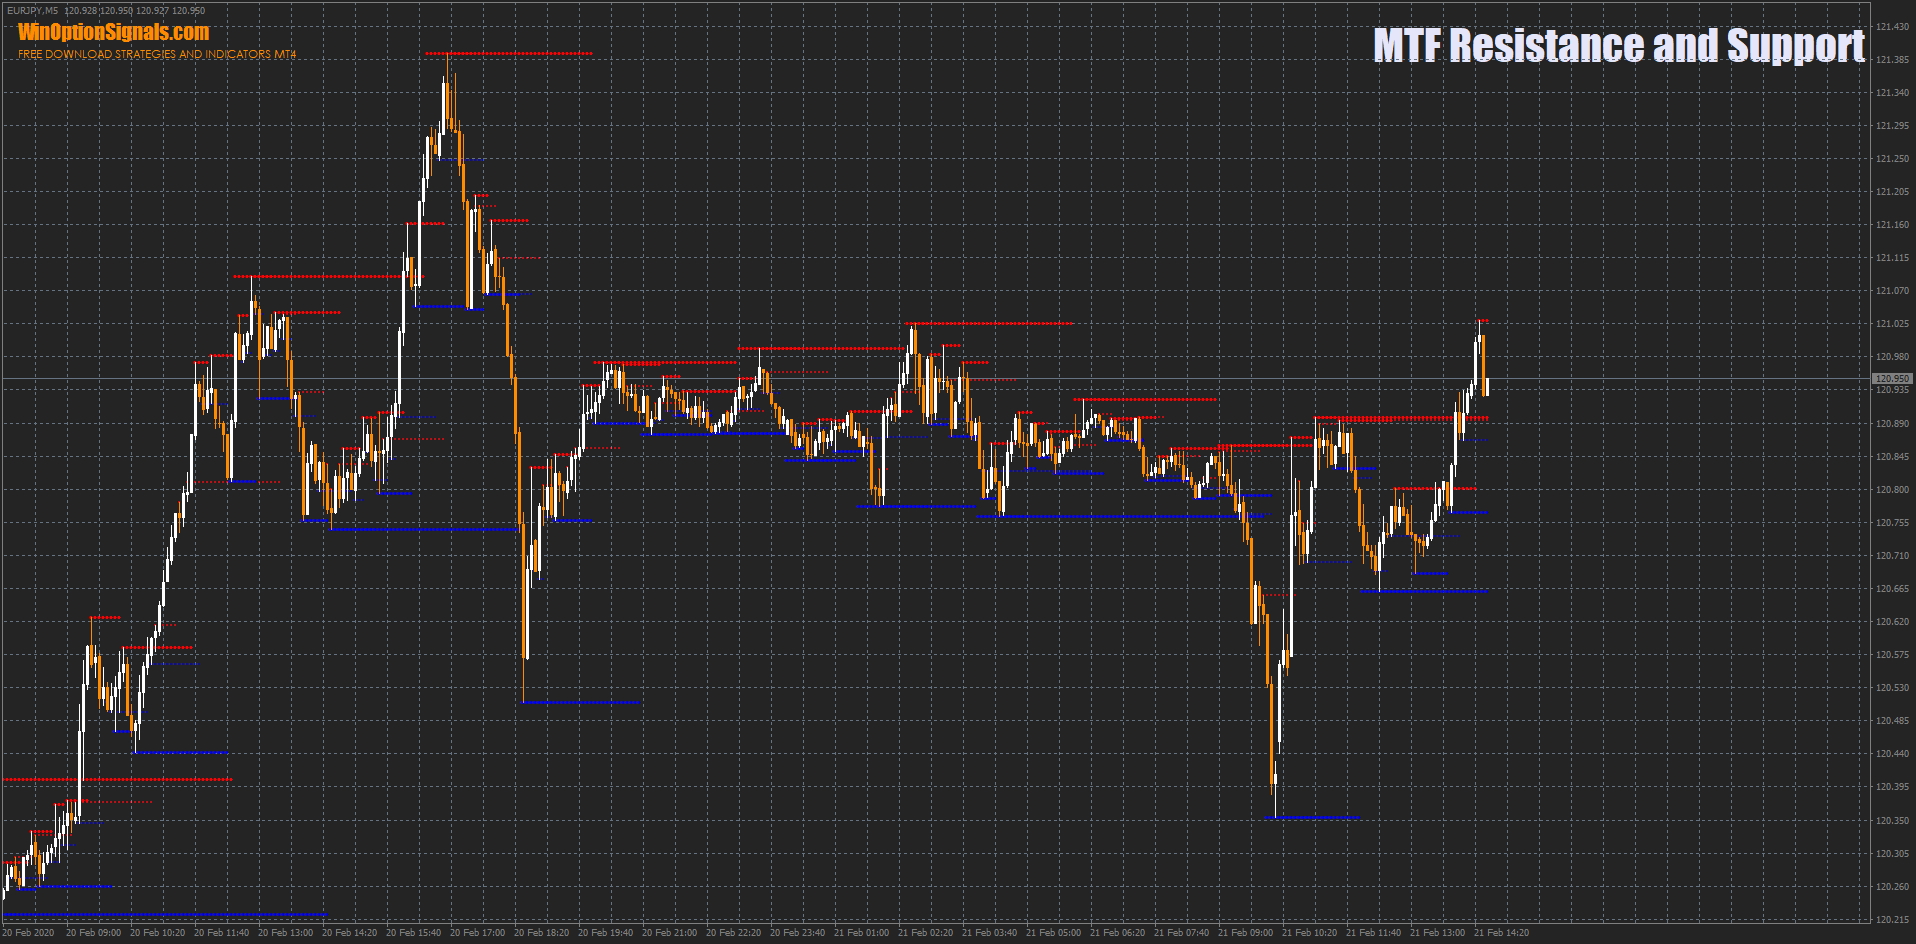
You can configure:
- Display information about levels.
- Automatic level building.
- Display levels from three time frames.
Download the MTF Resistance and Support indicator
Zone indicator
In addition to the standard calculation of support and resistance levels, this indicator has the ability to add its own algorithm to the calculation, which makes the construction of zones more accurate.
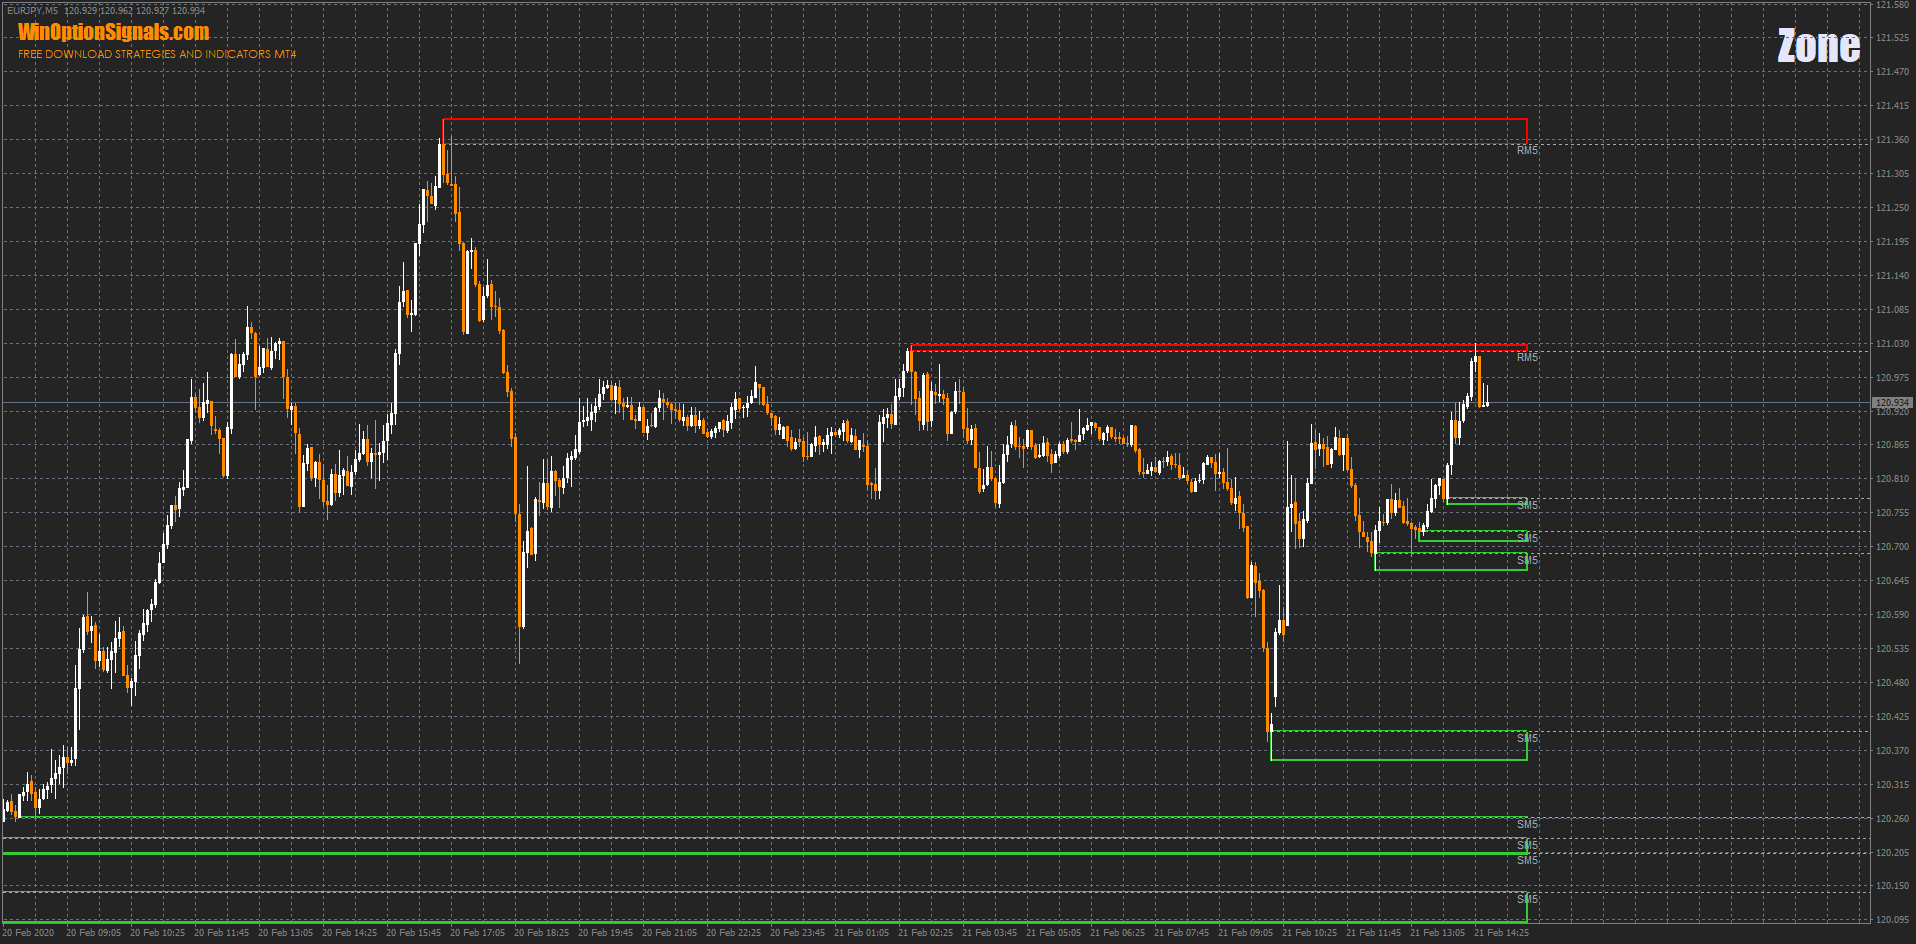
You can configure:
- Time frame used to build levels. That is, for example, on the M5 chart you can display levels from H1.
- The maximum number of bars for building levels.
- Level colors.
- The width and type of rectangles.
- Level shift.
Download Zone indicator
Power Dynamite Areas indicator
The indicator algorithm is based on the strength of Pivot levels, a given number of bars and the difference in points between the levels of a trading asset. This indicator well marks levels that the price will reach at least once in the future.
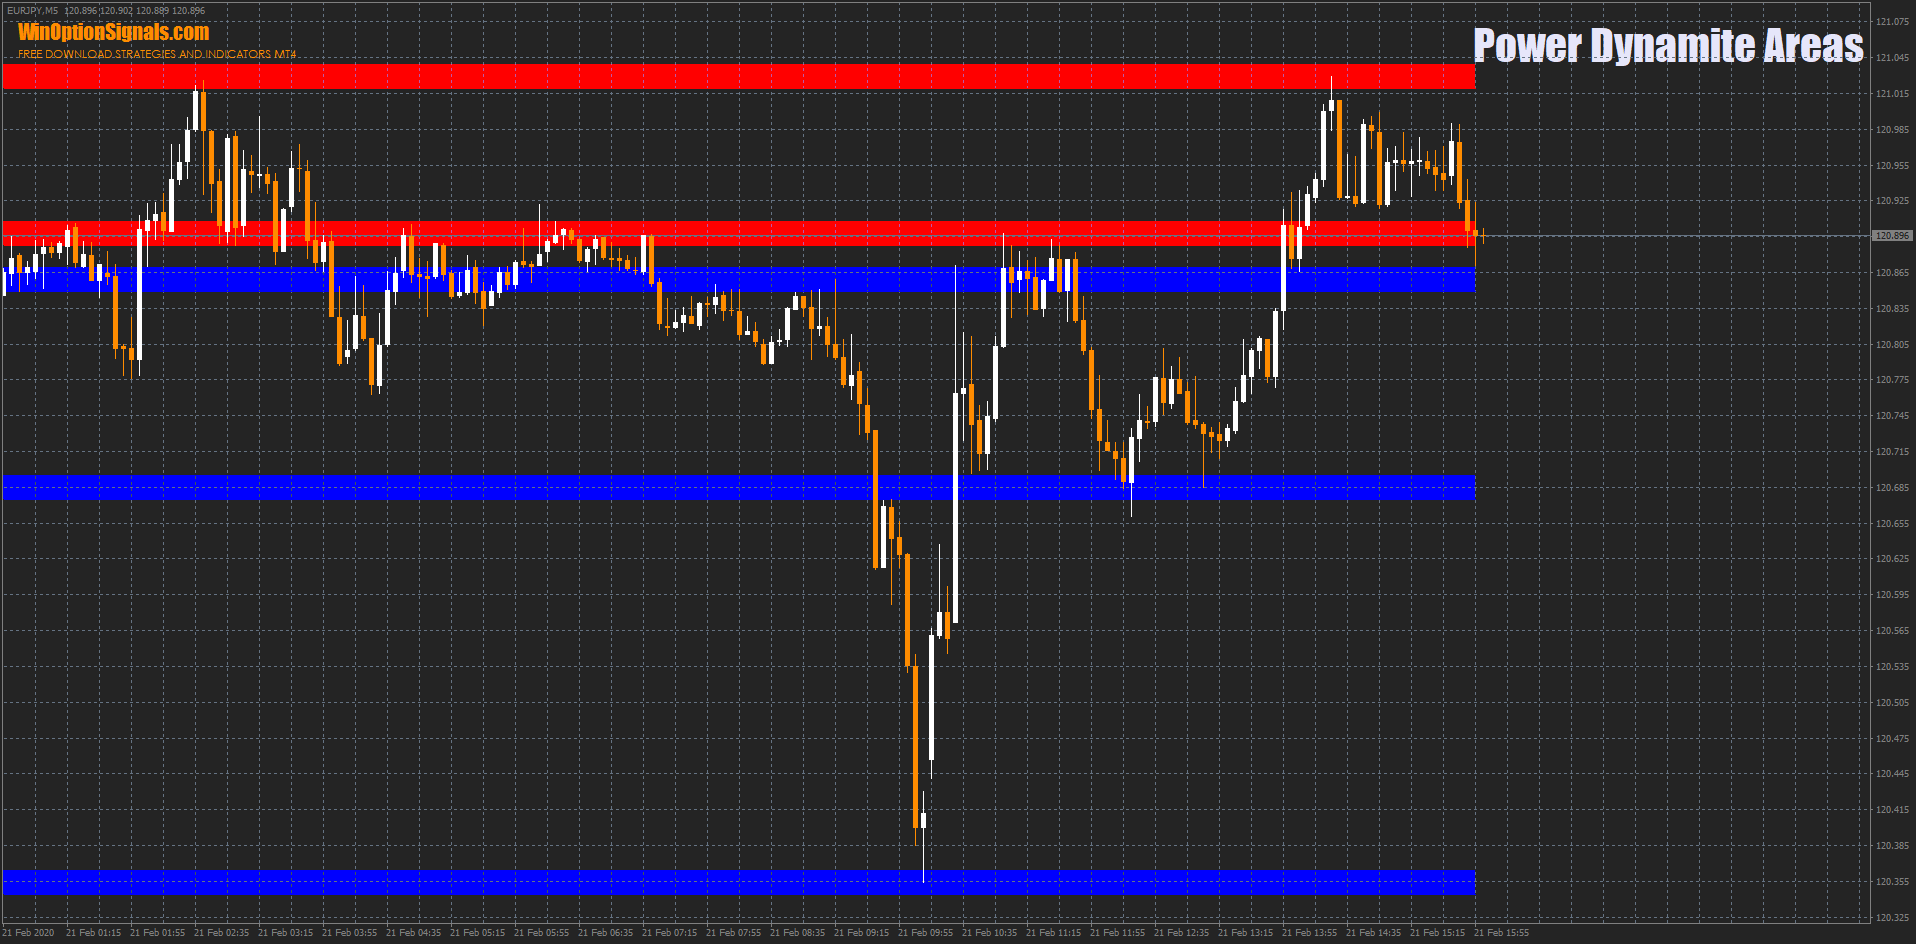
You can configure:
- The power of levels.
- The number of bars by which levels will be built.
- The difference is in points.
- Number of levels.
Download the Power Dynamite Areas indicator
PZ Pivot Points indicator
This indicator builds standard Pivot levels according to the classic formula, which you can find on the Internet and, if you wish, build the same levels yourself.
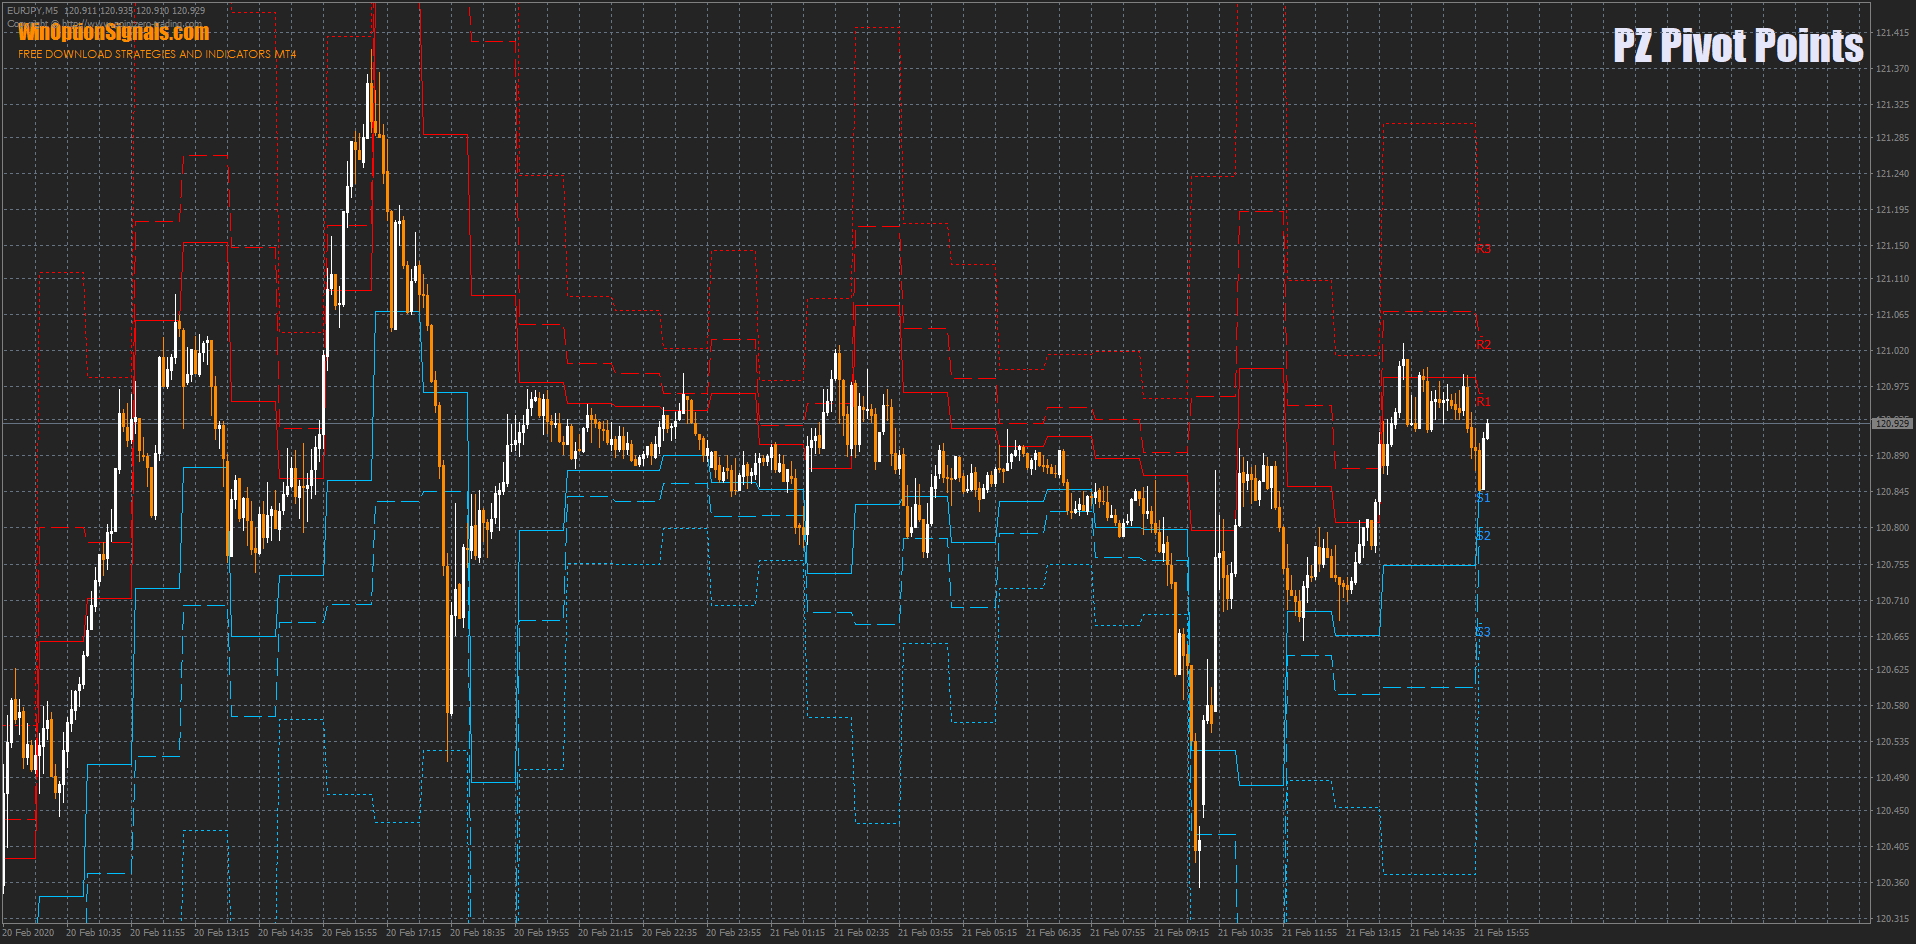
You can configure:
- Time frame for building levels.
- Colors.
Download the PZ Pivot Points indicator
Murrey Math indicator
The indicator's operating algorithm is based on William Gann's theory. To explain it in simple words, the indicator builds levels according to a certain unchanging algorithm based on time and price. As a result, the indicator builds eight main levels and four additional ones.
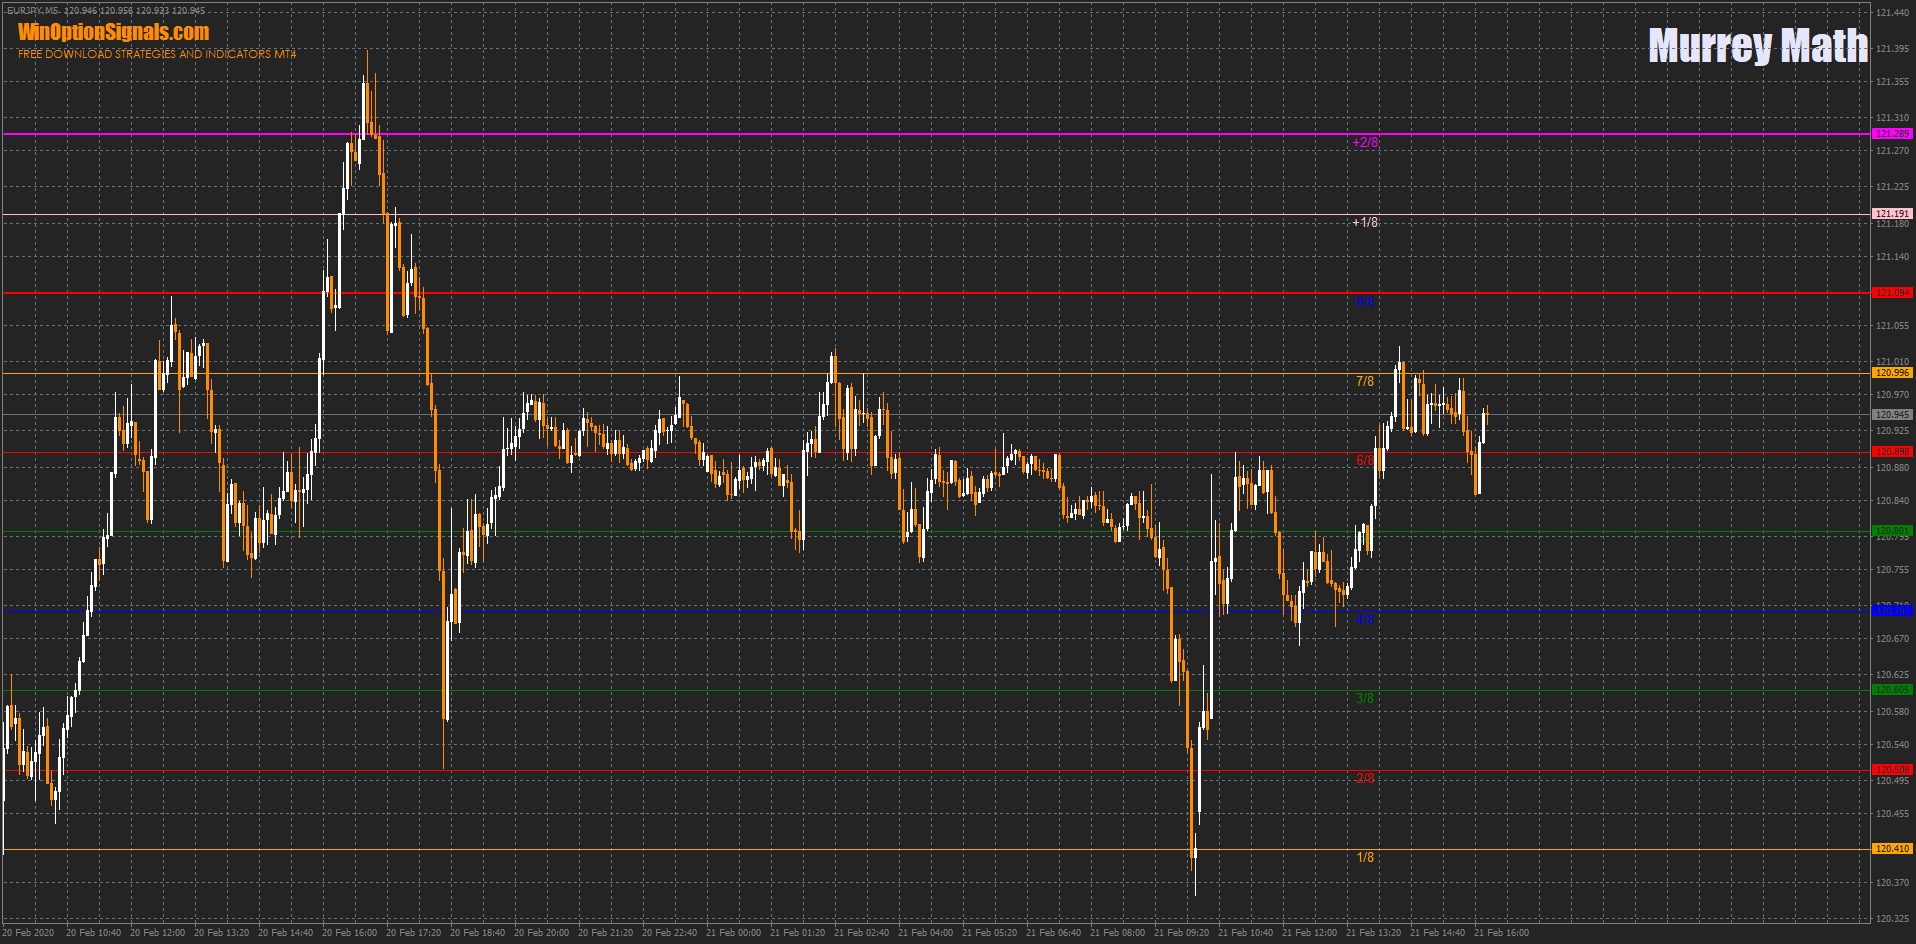
You can configure:
- Price range.
- Time range.
Download Murray Math indicator
Fibo Machine PRO indicator
The algorithm of this indicator is based on the idea of the Fibonacci number series, but instead of building all levels, which are often confusing, only the most relevant ones are built. In addition, all levels are designated based on their meaning. Stop loss and take profit levels are also indicated for Forex traders. And in addition to everything, this indicator contains an info panel that displays the following information:
- Current trend at the moment.
- Trend strength.
- Time until the end of the current candle.
- Current time of day.
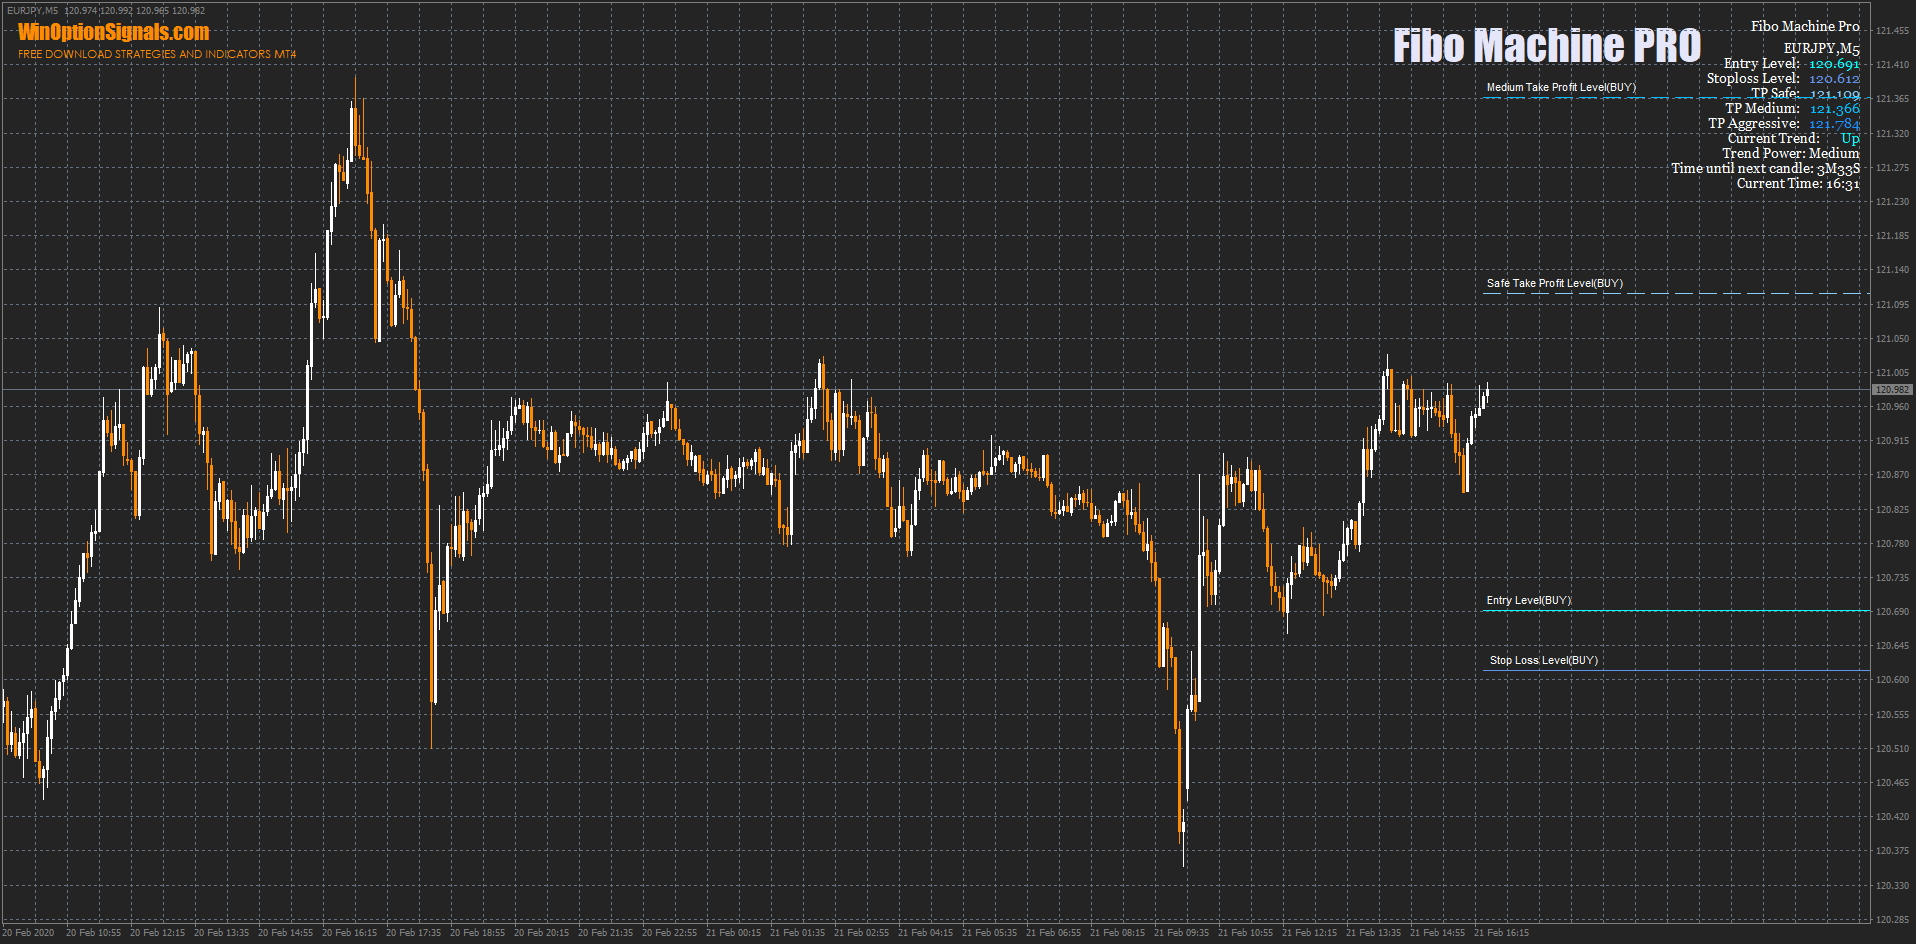
You can configure:
- Display the info panel.
- Info panel location.
- Sound alerts.
Download Fibo Machine PRO indicator
Conclusion
As you can see, today it is not necessary to build support and resistance levels manually. Indicators for binary options can do this job perfectly. All you have to do is choose the one that suits your experience and trading style.
But do not forget that it is better to test any trading ideas on a demo account first. If you have not yet chosen a broker, you can check out our rating of binary options brokers and choose the one that suits you. And we, in turn, wish you successful trading!
Can't figure out how this strategy or indicator works? Write about it in the comments to this article, and also subscribe to our YouTube channel WinOptionCrypto , where we will definitely answer all your questions in the video.
See also:
Binary options trading strategies
To leave a comment, you must register or log in to your account.