The indicator for binary options DSR levels identifies nine key levels from which a price rebound is most likely. Auxiliary arrow signals provide additional information about the price behavior when touching any of the levels and a hint about the direction of the transaction.
DSR levels indicator levels are calculated using the standard Nick Stott formula, developed back in 1989. These are known among traders as Camarilla levels and are valued in binary options trading as an accurate tool for short-term trades.
There are many free Camarilla level indicators that use the same formulas, but differ in visual parameters and alert systems. DSR levels is one of the successful examples of implementing such an indicator, complemented by clear arrow signals that simplify trading from levels. You can download it for free on our website at the end of this review.
Content:
- Characteristics DSR levels;
- Setting DSR levels;
- Review and settings of DSR levels;
- Trading rules according to DSR levels;
- Opening a Call option;
- Opening a Put option;
- Conclusion;
- Download DSR levels.
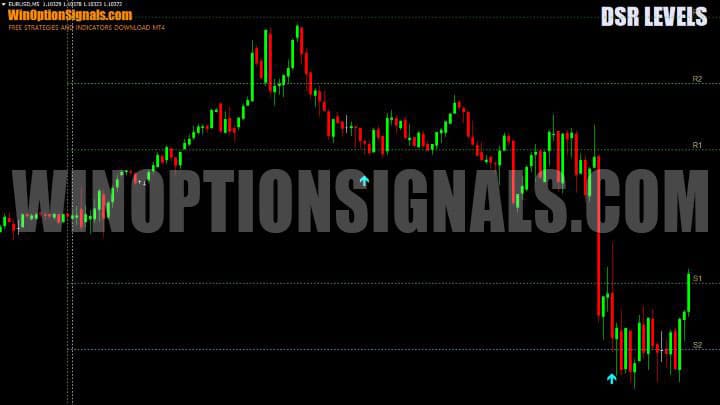
Characteristics of the indicator for binary options DSR levels
- Terminal: MetaTrader 4 ;
- Timeframe: M5;
- Expiration: 1 candle;
- Option types: Call/Put;
- Indicators: DSR_levels_alert.ex4;
- Trading instruments: currency pairs , commodities, cryptocurrencies , stocks;
- Trading time: 8:00-20:00 Moscow time;
- Recommended brokers: Quotex , Pocket Option , Alpari , Binarium .
Installing the indicator for binary options DSR levels
The DSR levels indicator is installed as standard in the MetaTrader 4 terminal. To do this, you need to add it to the root folder of the terminal by selecting “File” in MT4 and then “Open data directory”. In the directory that opens, you need to go to the “MQL4” folder and then to “Indicators”, and then drag the indicator file there. The template is installed in the same way, but is placed in the “Templates” folder. More detailed instructions for installing indicators can be viewed in our video:
Review and settings of the DSR levels indicator for binary options
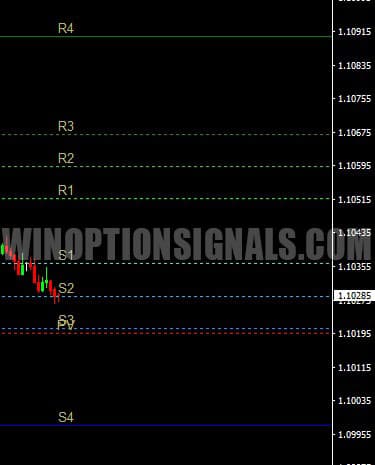
The DSR levels indicator calculates eight support and resistance levels , as well as an additional Pivot level. The four supports S1, S2, S3 and S4 are indicated by blue lines of different shades, the resistances R1, R2, R3 and R4 are indicated by green lines. The Pivot (PV) level is marked in red on the chart:
Camarilla levels are based on the previous day's prices and are used in the formula:
- highest price (H);
- lowest price (L);
- closing price (C).
Resistances are calculated using the following formulas:
R1 = (HL)x1.1/12+C
R2 = (HL)x1.1/6+C
R3 = (HL)x1.1/4+C
R4 = (HL)x1.1/2+C
Formulas for support levels:
S1 = C-(HL)x1.1/12
S1 = C-(HL)x1.1/6
S1 = C-(HL)x1.1/4
S1 = C-(HL)x1.1/2
The additional Pivot level uses the following formula:
PV = (H+L+C)/3
In addition to the levels, the DSR levels indicator for binary options trading displays auxiliary blue arrow signals:
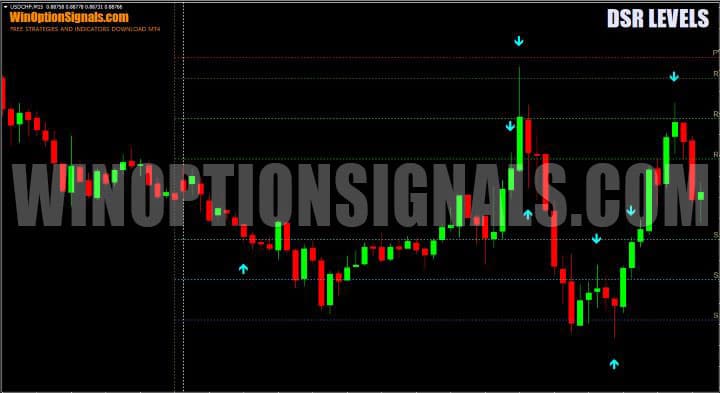
The DSR levels arrow signal appears subject to a certain Price Action when the level is touched. If the price, having approached the level from above, touched and closed above it with a red bearish candle, an upward arrow appears - a signal to buy a Call option. A down arrow (buy Put) is displayed on the chart if there is a rebound from below and the green candle closes below the level.
The DSR levels algorithm does not distinguish between support, Camarilla resistance and Pivot levels. Each of them can be used as a mirror indicator for a signal to buy a binary option:
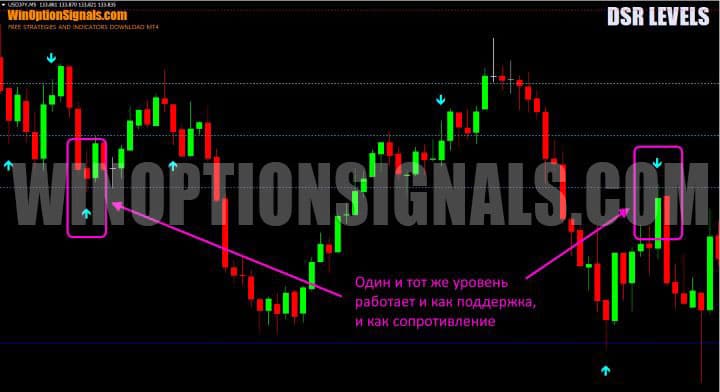
The arrow signal itself appears only at the moment the candle closes and is not redrawn under any circumstances.
Please note that the DSR levels arrow signal algorithm for binary options trading also contains the logic of price movement from level to level. Compliance with all the above conditions for the appearance of a signal does not lead to the appearance of an arrow, unless the price has previously bounced off the opposite level:
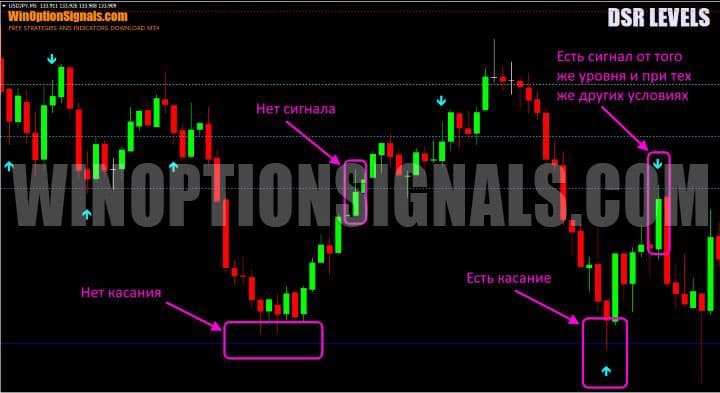
It is possible that the DSR levels algorithm contains other conditions for filtering trading signals, but it is not possible to know them reliably without access to the source code of the indicator.
DSR levels are numerous, but not significant. They allow you to adapt the alert system for touching the price of a level to your preferences and affect the visual parameters:
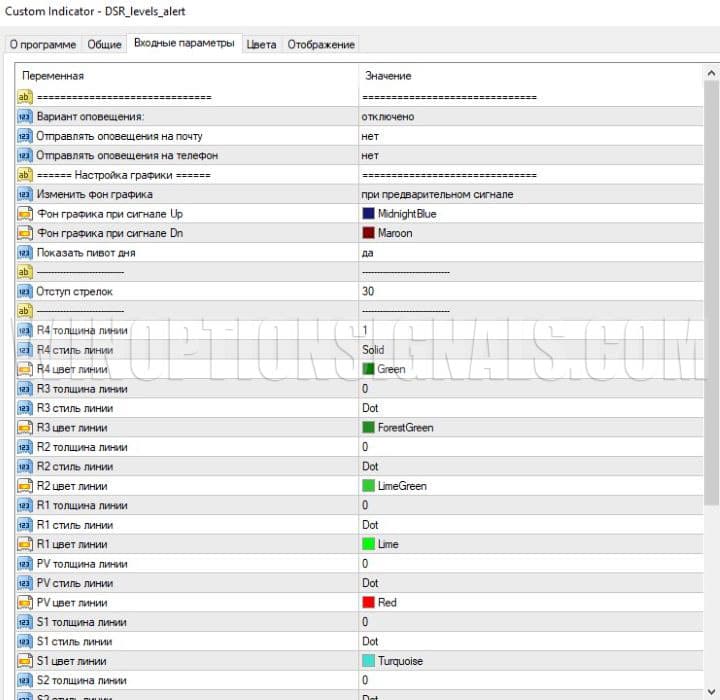
It is curious that when you select the “Disabled” option in the “Alert Option” parameter, the DSR levels indicator still uses one of the options for alerting about a signal to buy an option, namely, it changes the background color for the chart. In the conditions for buying Put options, the background turns red, and for Call options, the background turns blue.
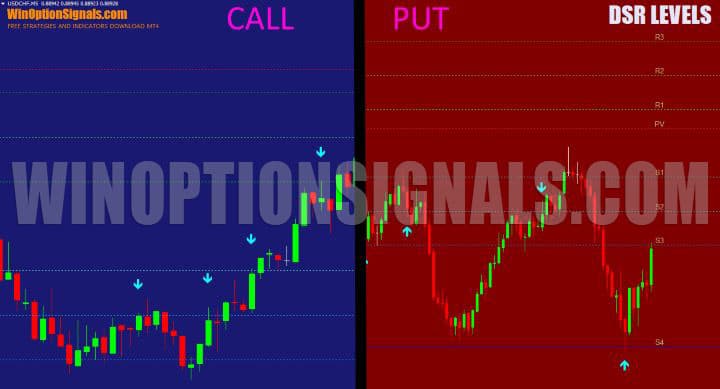
In the settings, you can select the option to display such a signal when the price touches a level (with a preliminary signal), when it is finally formed, or disable this alert.

The background for the graph will change only if the “Disabled” option is selected in the “Alert Option” parameter.

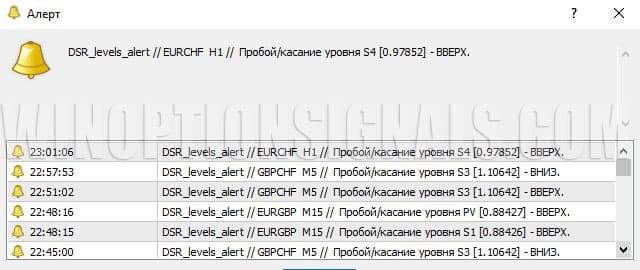
If you select the audio alert or pop-up alert option in the Alert Option option, the DSR levels alarm will be issued accordingly. Please note that in the pop-up alert window, the words “UP” or “DOWN” do not refer to the expected direction of the price after a bounce from the level, but rather that the level was hit when the price moved up or down, and therefore a rebound in the opposite direction is expected.
Trading rules using the DSR levels indicator for binary options
According to the results of our testing, the best results from the signals of this indicator can be obtained when trading on a five-minute timeframe . This is logical, since timeframes lower than M5 do not provide enough time for the formation of a reversal from the level, and higher ones allow the price, having shown the first reaction to the level, to continue moving in the direction of the local micro-trend that brought the price to the level. For this reason, the trading rules for the DSR levels indicator use the M5 time frame with a short expiration of one candle.
As with other indicators where trading is carried out from levels, such as Zain V4, Crypto Binary Options and others, you can improve the effectiveness of the strategy by adding an additional filter to the trading rules - trend direction. We explain why the trend is the most important criterion for selecting the best trading signals, and how to correctly determine its direction in a series of educational materials:
- How does a trend work in markets?
- Identifying and using bullish and bearish trends.
- Market phase changes .
- How to determine a flat in the market?
Thus, the rules for trading binary options using the DSR levels indicator come down to the following conditions:
To buy a Call option:
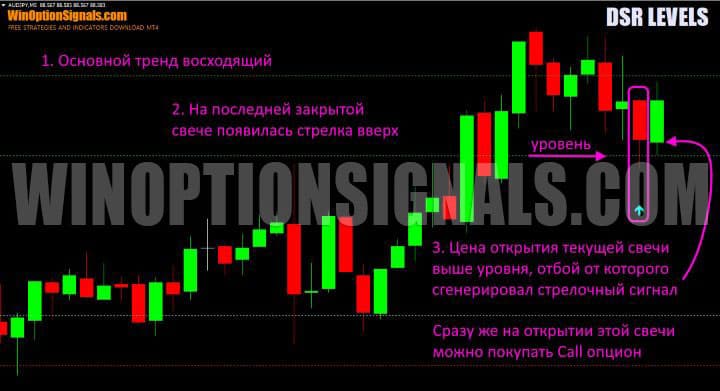
- The main trend is upward.
- A signal appeared on the just closed candle – an up arrow.
- The new candle opened above the level from which the price bounced up in the previous candle.
Immediately at the opening of this candle, following the candle with an arrow signal, you can buy a Call option. The timeframe should always be M5 and the expiration time is 5 minutes.
To buy a Put option:
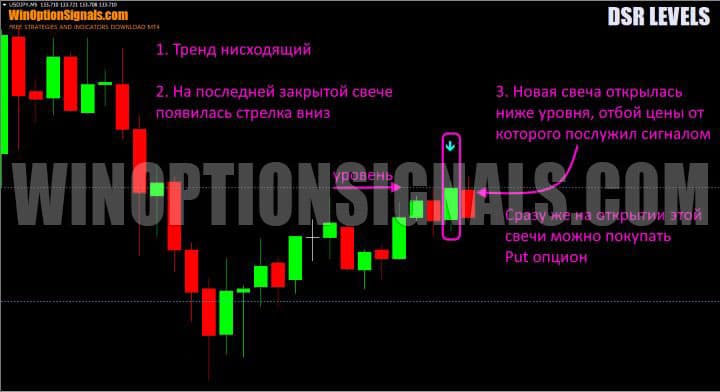
- The main trend is downward.
- A downward arrow appeared on the newly closed candle.
- The new candle opened below the level from which the price bounced down in the previous candle.
Immediately at the opening of this candle, you can buy a Put option.
Opening a Call Option
In this case, the AUD/JPY pair is in an upward trend. After the price rebounded from the support level after closing the candle that touched the level, a blue upward arrow appeared below it. At the opening of a new candle, making sure that it opened above the level, you should immediately buy a Call option with an expiration of 5 minutes.
Opening a Put option
In this example, the USD/JPY pair is in a downward trend. The price rebounded from the downward level and after this green candle closed, a blue signal appeared above it - a downward arrow. A new candle opened below the level, so you can immediately buy a Put option with an expiration of 5 minutes.
Conclusion
Trading binary options using the DSR levels indicator is quite simple, so it is suitable for traders with any level of experience.
The Camarilla levels on which this strategy is based often cause a short-term price rebound, but are not strong enough to hold back or reverse the price globally for a long time. For this reason, the trading strategy based on the DSR levels indicator is designed for binary options with short expiration.
Flexible settings for indicator alerts allow you to trade on many instruments simultaneously, receiving audio and visual alerts about the occurrence of trading signals. Their frequency is optimal, and the big advantage is that the arrows are not redrawn under any circumstances.
According to our observations, the win rate of DSR levels signals without taking into account the trend on a five-minute timeframe is about 60%, therefore, for successful trading of binary options in this strategy, it is necessary to filter the signals, taking into account the direction of the main trend of the asset.
When testing the indicator yourself, be sure to use only a demo account for experiments and practice. Compliance with the rules of money management and risk management is also important to increase the effectiveness of the strategy on a real account. A reliable broker can be found in our rating of binary options brokers .
Download the DSR levels indicator for free
See also:
How to make money on binary options
How do binary options brokers make money?


To leave a comment, you must register or log in to your account.