
The 3 MA Cross binary options indicator uses a time-tested approach – moving average crossing. However, unlike other indicators, it offers its users several operating modes, two of which we will consider in this review. If you want to know which settings of this tool provide the best results, we recommend reading to the end.
Content:
- Characteristics
- Installation
- Overview and Settings
- Trading Rules for 3 MA Cross
- Opening a Call Option
- Opening a Put Option
- Conclusion
- Download 3 MA Cross

Characteristics of the Indicator for Binary Options 3 MA Cross
- Terminal: MetaTrader 4
- Timeframe: M5
- Expiration: 2-3 candles
- Option Types: Call/Put
- Indicators: 3-ma-cross.ex4
- Trading instruments: currency pairs, commodities, cryptocurrencies, stocks
- Trading hours: 7:00-19:00 (GMT+2)
- Recommended brokers: Quotex, Pocket Option, Alpari, Binarium
Installing the Indicator for Binary Options 3 MA Cross
The 3 MA Cross indicator is installed in the MetaTrader 4 platform in a standard way. To do this, add the indicator to the root folder of the terminal: open the “File” menu in MetaTrader 4 and select “Open data directory”. In the window that opens, go to the “MQL4” → “Indicators” folder and move all the files there. Templates are installed in the same way, but they need to be placed in the “templates” folder. For more information on installation, watch our video:
Review and Settings of the Indicator for Binary Options 3 MA Cross
The 3 MA Cross binary options indicator, as the name suggests, generates trading signals at the moment of crossing moving averages. This is probably not only the most popular, but also the simplest method of technical analysis used by binary options traders to determine the direction of the trend. In the simplest version, two moving averages are used. However, the indicator we will consider today uses three exponential moving averages with different calculation periods: 5, 15 and 50 candles.

Moving averages allow you to visually assess changes in price behavior over different time periods. Short averages are more sensitive to these changes than long ones, which reflect a long-term trend.
Now let's figure out how signals are formed at the intersection of moving averages? It's very simple: a signal to buy a Call option occurs when the short average crosses one of the long ones from the bottom up.
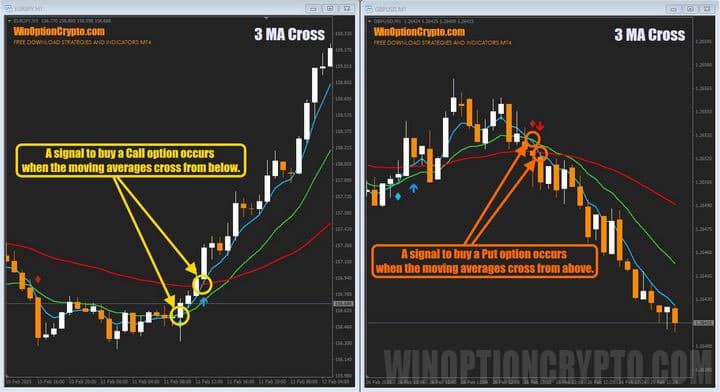
For Put options, the situation is the opposite – a signal to buy them occurs when the short average crosses one of the long ones from top to bottom.
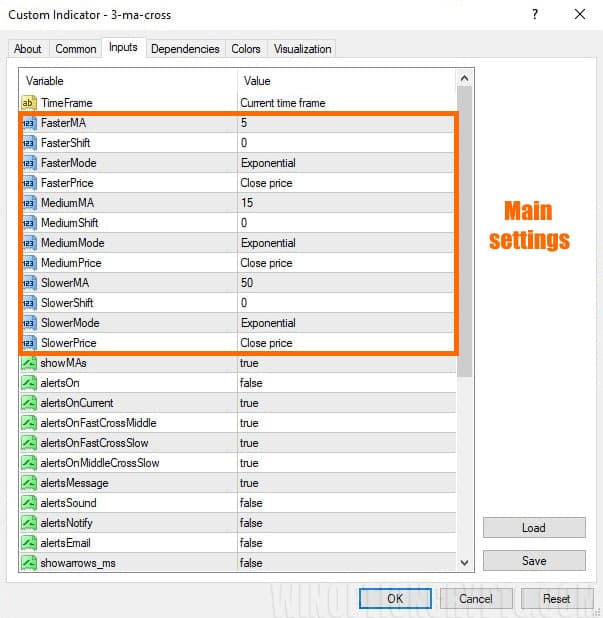
Now let's look at the settings of this indicator. They include two main blocks: the main one, where you can set the calculation period and select the type of moving averages, and the block for visualizing trading signals.
|
|
|
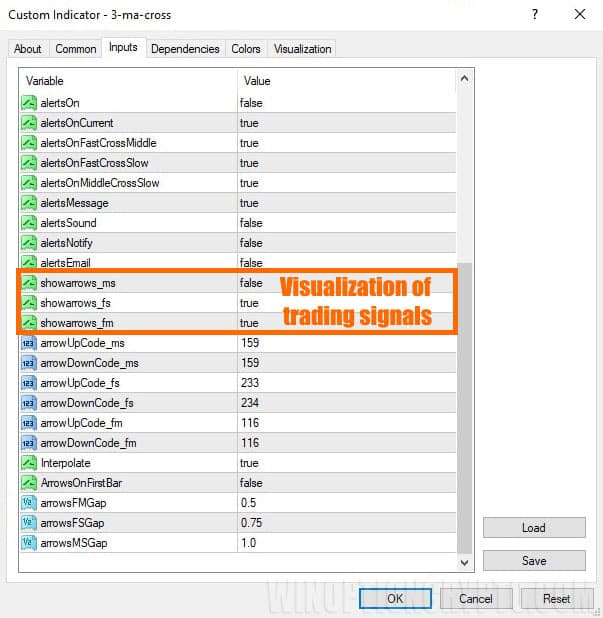
The binary options indicator 3 MA Cross generates three signals: at the intersection of fast, medium and slow moving averages. Each of them is displayed on the chart with its own icon. In this review, we will use two types of signals - intersection with the medium and long moving average: showarrows_fs and showarrows_fm.
As you can see in the image above, the signal to buy Put options at the intersection with the moving average is marked by the 3 MA Cross indicator with a red diamond, and at the intersection with the long moving average – with a red arrow. For buying Call options, similar signals are marked with a blue diamond and an arrow.
Trading Rules for Binary Options Indicator 3 MA Cross
The 3 MA Cross binary options indicator generates multiple trading signals without redrawing. As an additional filter, you can use any trend indicator described in the article " The Best Binary Options Trend Indicators". However, in this review, we will not use them and leave the 3 MA Cross settings by default. Even in this case, its signals can be trusted.
If you want to learn more about what binary options signals are, we recommend reading our selection of articles on this topic:
- Is it worth buying trading signals for binary options?
- Pocket Option Signals
- WinOptionSignals Signals Review
- Profitable signals for binary options
Opening a Call Option
- We are convinced of the upward trend: the moving averages are located one above the other in order of increasing their calculation period. (5-15-50)
- A blue diamond or arrow appears.
- At the opening of a new candle we buy a Call option.
Opening a Put Option
- We are convinced of the downward trend: the moving averages are located one under the other in descending order of their calculation period. (50-15-5)
- A red diamond or arrow appears.
- At the opening of a new candle we buy a Put option.
It is recommended to select the expiration time of 3 candles. We advise you to select the holding period of positions based on the results of testing on historical data.
Specifics of Using the Indicator for Binary Options 3 MA Cross
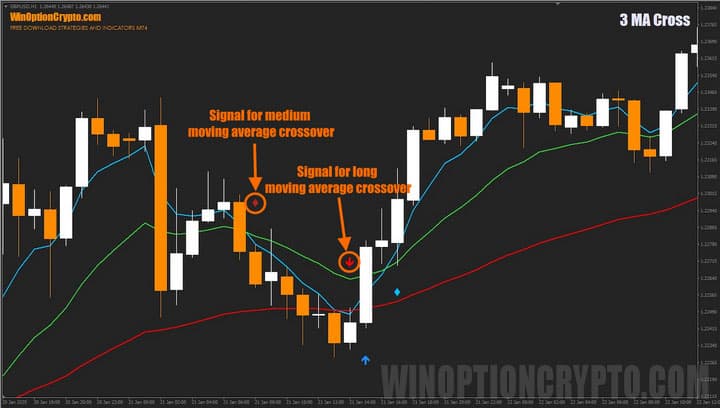
We have established empirically that the 3 MA Cross indicator generates the best signals at the moment of resumption of the trend movement. It is even better if at the moment of such a signal there is an intersection of two moving averages, and two marks appear on the candlestick chart at once: a rhombus and an arrow. The image below shows just such an example.
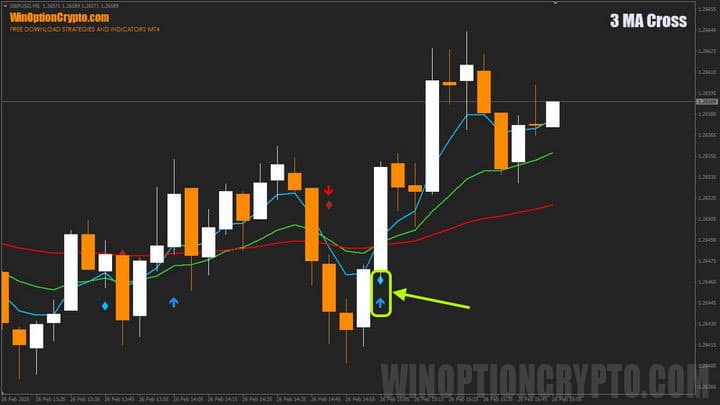
In addition to these features, we recommend using this indicator during active financial market hours, which you can learn more about in the article "Best Time to Trade Binary Options". From it, you will learn about the appropriate time to trade currency pairs, cryptocurrency, stocks and stock indices.
Pros of the 3 MA Cross Indicator
The advantages of the 3 MA Cross indicator are obvious - its ease of use. Moving averages are familiar to many traders from the first days of trading. Objectively, this is the simplest and most understandable technical indicator available today. Knowing how to use it correctly will greatly help you understand how trends arise in the market and how you can benefit from it. An additional advantage will be the ability to use 3 MA Cross on different timeframes.
Disadvantages of the 3 MA Cross Indicator
The disadvantages of the 3 MA Cross indicator include the delay of its signals in rapidly changing markets. In conditions of high volatility, the moving averages underlying this tool do not keep up with the price fluctuations of the asset. Therefore, try to choose financial instruments and a time frame where there are no chaotic price movements and a general trend is visible. In addition, to filter out false signals, you can use additional indicators, candlestick patterns, as well as important support and resistance levels.
Conclusion
The 3 MA Cross binary options indicator is based on a simple, but at the same time very effective method of technical analysis. With its help, binary options traders will be able to determine not only the direction of the trend, but also the best moments for concluding transactions. However, despite all the advantages, always remember the disadvantages of this indicator. Use additional filtering methods to increase the percentage of profitable transactions, test the work on a demo account from a reliable broker and always apply the rules of risk and capital management. We wish everyone successful trading!
Download Indicator

To leave a comment, you must register or log in to your account.