
The XMR Indicator for binary options is a tool that is built on extreme mean reversion. The indicator's algorithm is based on scanning the previous price movement, thanks to which it is possible to obtain signals about potential overbought or oversold levels in the market. The indicator also has an additional module that generates signals on the chart for clearer entry points into a trade.
Please note that XMR Indicator is a paid tool and costs $49.99, but you can download it for free from our website for review.
Content:
- Characteristics of XMR Indicator;
- Installation of XMR Indicator;
- Review and settings of XMR Indicator;
- Trading rules using XMR Indicator;
- Opening Call;
- Opening Put;
- Conclusion ;
- Download the indicator .
Characteristics of the indicator for binary options XMR Indicator
- Terminal: MetaTrader 4 .
- Timeframe: H1-H4.
- Expiration: 2 candles.
- Types of options: Call/Put.
- Indicators: XMR Indicator.ex4, XMR Indicator - Arrows.ex4.
- Trading instruments: currency pairs , stocks, cryptocurrencies , commodities.
- Trading time: 8:00-20:00 Moscow time.
- Recommended brokers: Quotex , PocketOption , Alpari , Binarium .
Installing an indicator for binary options XMR Indicator
The XMR Indicator indicator is installed as standard in the MetaTrader 4 terminal. To do this, you need to add it to the root folder of the terminal by selecting “File” in MT4 and then “Open data directory”. In the directory that opens, you need to go to the “MQL4” folder and then to “Indicators”, and then drag the indicator file there. The template is installed in the same way, but placed in the “Templates” folder. More detailed instructions for installing indicators can be viewed in our video:
Review and settings of the XMR Indicator for binary options
As mentioned at the beginning of the article, this indicator is divided into two tools:
- bar chart;
- arrows.
Next, let's look at each of them in more detail.
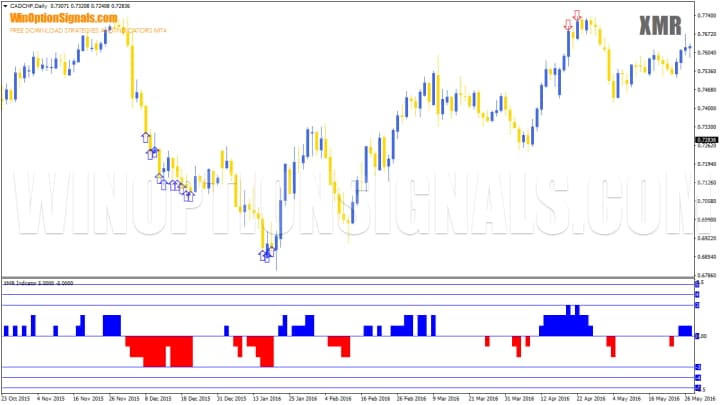
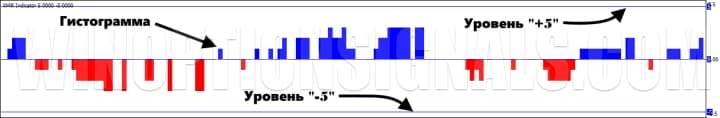
XMR Indicator (histogram)
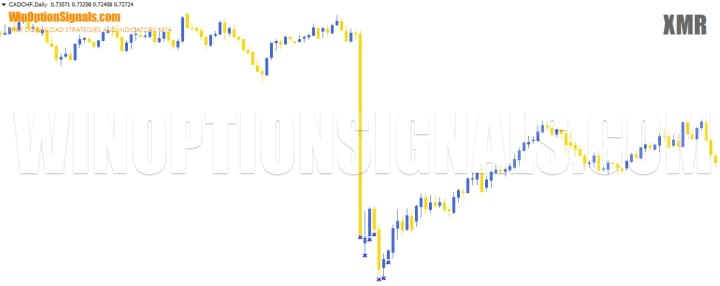
This indicator for binary options is displayed as a histogram with ranges from “-5” to “+5”. A range of “+5” is considered extremely overbought, and “-5” is considered extremely oversold:
The tool was created taking into account the concept that price always returns to its average value. You can use this to search for trading assets that have significantly moved away from their historical values and a reversal can be expected on them. That is, if the histogram is at the values “+3” and above, or “-3” and below, then this indicates strong overbought/oversold conditions and we should expect a reversal in the near future.
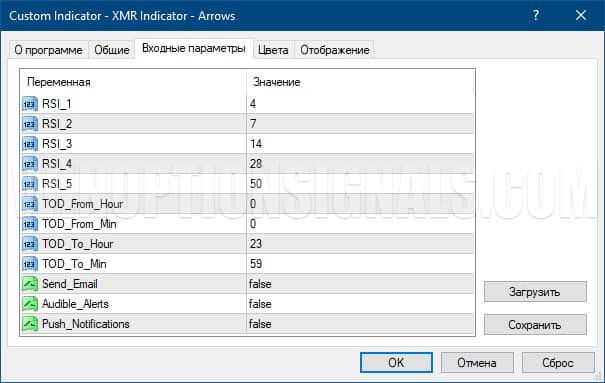
The XMR Indicator settings are initially balanced, but you can change them if desired:
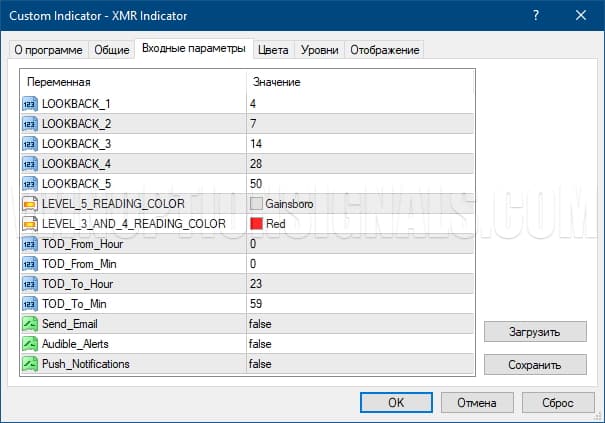
In order for the histogram to generate other values, you should change the parameters “LOOKBACK_1-LOOOKBACK_5”. You can also connect alerts.
XMR Indicator – Arrows (arrows)
This indicator generates signals that work in conjunction with the histogram. The operating algorithm of this tool is exactly the same as that of the histogram, but in addition they use the RSI indicator :
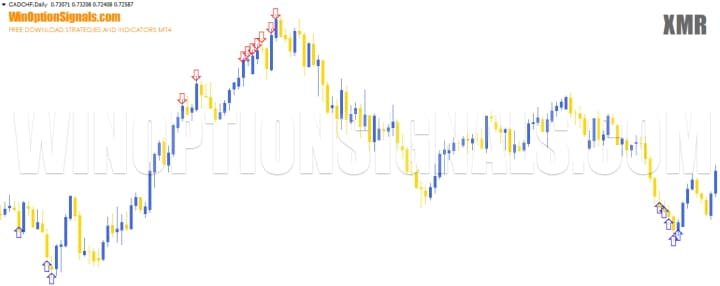
Sometimes you can see crosses along with arrows on the graph:
Essentially, these are the same arrows, but in a different form. Therefore, it does not matter what appears on the chart, arrows or crosses, both will be a signal to enter a trade.
The signal indicator settings are very similar to the histogram settings, but there are parameters from RSI. And here you can also enable alerts to receive notifications about signals:
Trading rules using the XMR Indicator for binary options
When trading binary options using XMR, you need to pay attention to both instruments. When observing the histogram, you should pay attention to the bars where blue ones indicate overbought and red ones indicate oversold conditions. We do not use the values “-2” and “+2”, since these are very weak zones. Values from “-3” to “-4” or from “+3” to “+4” are considered stronger. When the price reaches “-3” or “+3”, you can consider buying options. The values “-5” and “+5” are very rare, but they are the most powerful levels. A better option would be to use both positive and negative values "4" and "5".
When watching the arrows, pay attention to the fact that one arrow does not indicate buying an option. The minimum required number of arrows is two. The best option is four to five arrows.
Based on the above, to purchase Call options you need to:
- The histogram was red (oversold) and was at a value of “-4” or “-5”.
- Appeared from two or more blue arrows or crosses (it is possible to have both crosses and arrows together).
To purchase Put options you need to:
- The histogram was blue (overbought) and was at the value “+4” or “+5”.
- Appeared from two or more red arrows or crosses (it is possible to have both crosses and arrows together).
Any timeframe can be used, and expiration should be 2 candles.
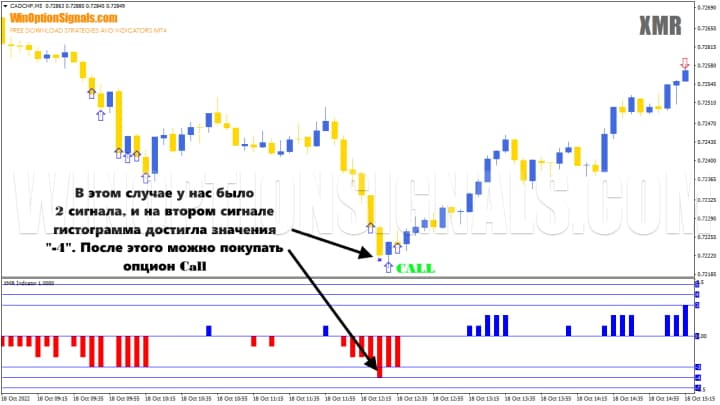
Opening a Call Option
In this case, two signals appeared before the histogram reached the value "-4". After that, you could buy a Call with an expiration of 2 candles:
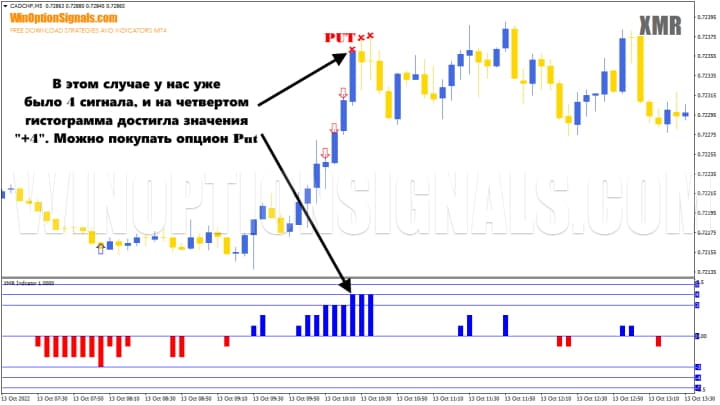
Opening a Put option
In this case, four signals appeared, after which the histogram reached the value “+4”. After this, you could buy Put with an expiration of 2 candles:
Conclusion
The XMR Indicator can be called a trading system that is self-sufficient and allows you to start trading binary options without using additional tools. But despite this, be sure to test it in action on a demo account , and also study it on history or through a tester, and only after that start using it on a real account.
In addition, in order to protect your deposit, you should always remember the rules of money management and risk management , and also trade only through a trusted broker, which can be found in our rating of binary options brokers .
XMR Indicator free download
Can't figure out how this strategy or indicator works? Write about it in the comments to this article, and also subscribe to our YouTube channel WinOptionCrypto , where we will definitely answer all your questions in the video.

See also:
How to make money on binary options
How do binary options brokers make money?
To leave a comment, you must register or log in to your account.