
Pivot levels in binary options (support levels) are one of the technical analysis tools that are used in the same way as support and resistance levels . That is, in both cases, traders determine zones upon reaching which the price chart should turn in the opposite direction.
Pivot Points are built according to certain formulas that take into account indicators taken over the past period. This means that the tool in question is used to determine zones in the near future based on data taken from the past. That is, using the pivot levels indicator , the trader expects that after the completion of a given time interval, the chart will reach the desired values.
Content:
- The principle of operation of pivot levels in binary options;
- Traditional calculation of pivot levels;
- Calculation of pivot levels according to DeMark;
- Calculation of pivot levels according to Woody;
- Calculation of pivot levels for the Camarilla;
- Pivot levels calculator (online calculation);
- Pivot levels: indicator from Trading View;
- Pivot levels indicator for MT4: Pivot Points AiO;
- Pivot levels: how to trade;
- Opening a Call option;
- Opening a Put option;
- Conclusion ;
- Download the indicator .
How pivot levels work in binary options
You can understand the principle of operation of Pivot in binary options trading if you find out on what formulas this tool works. Several types of calculations are used to determine support and resistance lines. This is due to the fact that the first formula, on the basis of which the pivot is calculated, was later supplemented and revised by analysts. As a result, several options for constructing zones appeared, which is explained by the difference in opinions among traders who modified the formulas for calculations. Basic pivot points for MT4 look like this:
Despite the wide variety of types of pivot levels for MT4, it is recommended to use the following for trading binary options:
- Traditional . They are considered more popular among traders working with currency pairs .
- Classic . This option differs from the previous one by minor changes in the calculation formula.
- By Woodie . When calculating future boundaries, users give more weight to the closing price.
- According to DeMark . This pivot calculation appeared at the beginning of 2010 to determine the direction of price movement during that period.
- According to Fibonacci . The formula is calculated using price correction zones, which are determined by Fibonacci numbers.
- According to the Camarilla . Support points are calculated using a method similar to the classical one.
To understand how pivot points are determined and how to trade using this instrument, it is necessary to consider the features of the formulas used to calculate support and resistance lines.
Traditional calculation of pivot levels
This option is considered the easiest to build. In this case, to determine the moments of a possible reversal, values obtained for previous periods (for yesterday, a week, a month, and so on) are used. Three parameters are used in the calculations:
- High, or the maximum price reached for the selected timeframe ;
- Low, or minimum price;
- Close, or closing price.
These values are added and divided by “3” P = (Close + High + Low) / 3. Additionally, it is necessary to calculate the three starting points of the support lines (R – Resistance) and resistance (S – Support):
- R1 = 2 * P – Low;
- S1 = 2 * P – High;
- R2 = P + (R1 – S1);
- S2 = P – (R1 – S1);
- R3 = High + 2 * (P – Low);
- S3 = Low – 2 * (High – P).
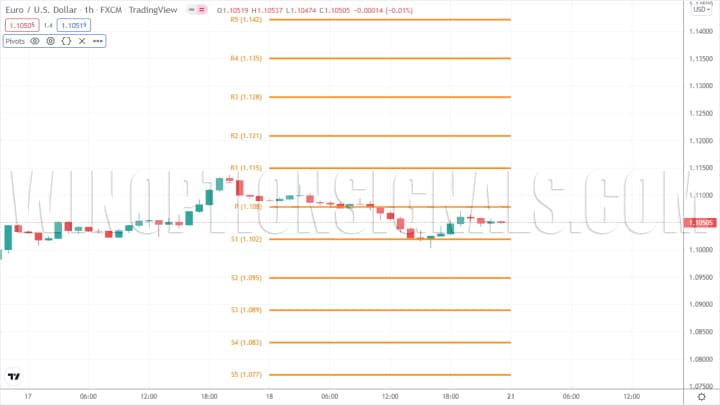
After calculations, the results obtained will be reflected on the graph in the form of seven lines:
- S1;
- S2;
- S3;
- Pivot Point;
- R1;
- R2;
- R3.
Calculation of pivot levels according to DeMark
This calculation has an important feature that determines future results. When making calculations , the trend is taken into account: bullish or bearish . That is, the direction of the asset is first determined, after which the calculations are performed:
- if the opening price is greater than the closing price, then P = High + 2 * (Low + Close);
- if less, then P = 2 * High + Low + Close;
- if they match, then P = High + Low + 2 * Close.
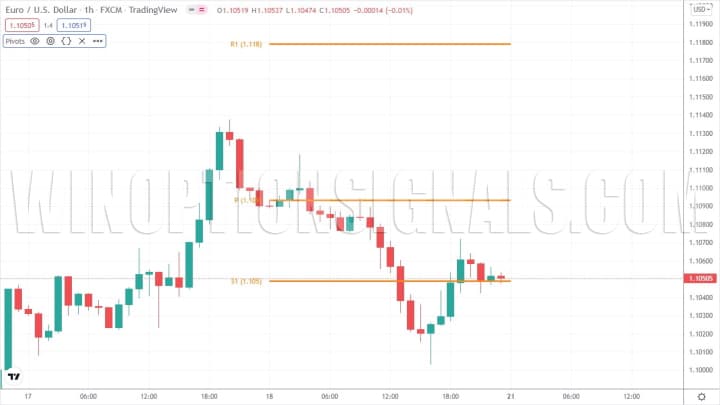
In this case, R1 = P / 2 – Low, S1 = P / 2 + High and we get three lines:
Calculation of pivot levels according to Woody
In this case, the value calculated using closing prices takes on greater weight. To determine the reference points, the following calculations are used:
- P = (2 * Close + High + Low) / 4;
- R1 = 2 * P – Low;
- S1 = 2 * P – High;
- R2 = P + High – Low;
- S2 = P – High + Low.
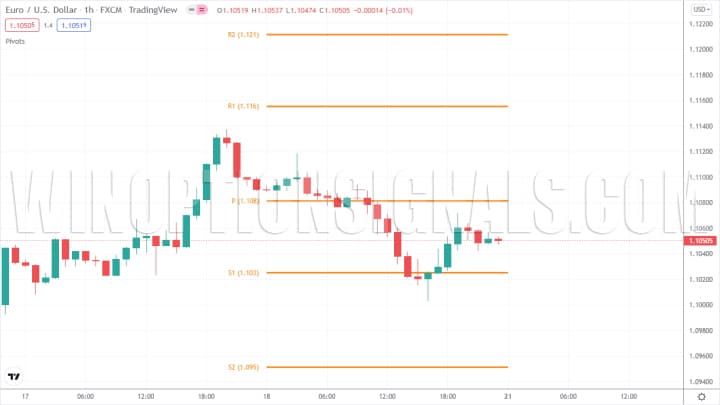
When plotting Pivot Points, seven horizontal lines should appear:
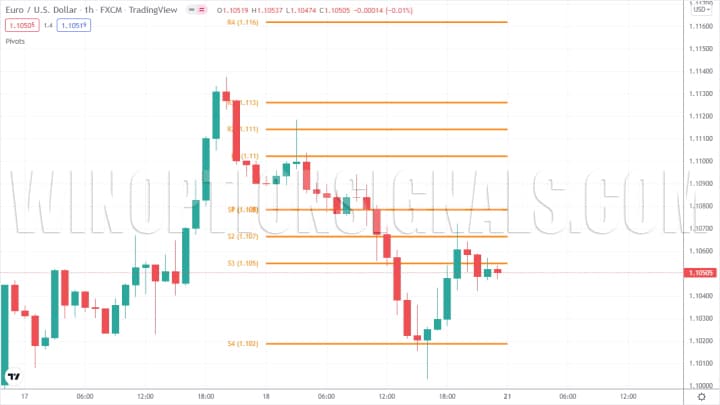
Calculation of pivot levels for the Camarilla
Pivot points calculated using this formula give eight lines of support and resistance. This option is more often used in Forex trading. Traders use the resulting price zones to set take profits and stop losses. To calculate these points, you need to use the following formulas:
- R4 = (High – Low) * 1.1 / 2 + Close;
- S4 = Close – (High – Low) * 1.1 / 2;
- R3 = (High – Low) * 1.1 / 4 + Close;
- S3 = Close – (High – Low) * 1.1 / 4;
- R2 = (High – Low) * 1.1 / 6 + Close;
- S2 = Close – (High – Low) * 1.1 / 6;
- R1 = (High – Low) * 1.1 / 12 + Close;
- S1 = Close – (High – Low) * 1.1 / 12.
Pivot levels calculator (online calculation)
To simplify the construction of pivot lines, indicators have been created that can be downloaded for various trading terminals, including MetaTrader 4 . Also, to determine the reference points, you can use the online pivot level calculator from Investing, which will help calculate all zones without using formulas:
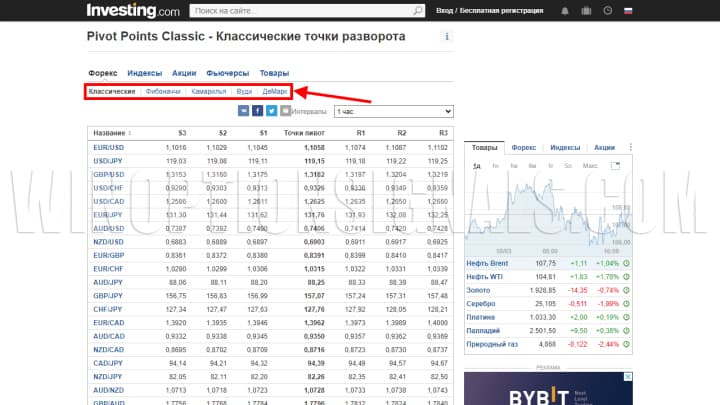
This pivot level calculator contains information with constructions on:
- Classic;
- Camarilla;
- Fibonacci;
- Woody;
- DeMark.
Also in the table you can view the parameters S1-Sn, R1-Rn and assets for which points are displayed. There is a choice:
- Forex;
- Indexes;
- Stock;
- Futures;
- Goods.
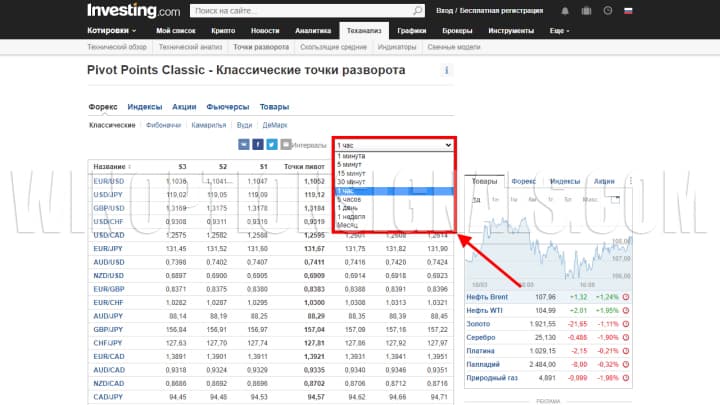
In addition, the calculator has a time frame selection function. Depending on the selected interval, the parameters of the pivot points change, since the period for which the indicators are taken for calculations changes:
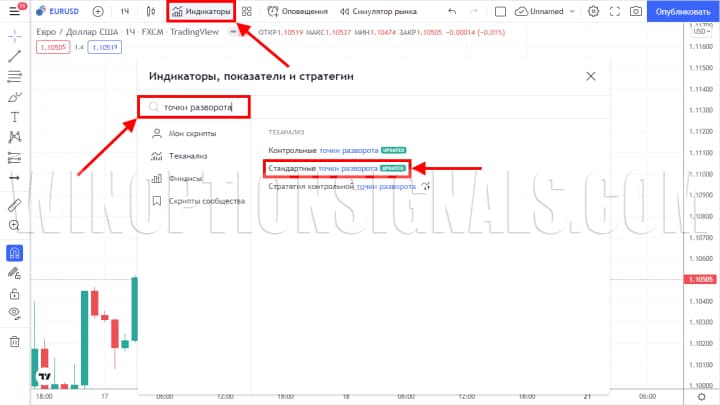
Pivot levels: indicator from Trading View
Above, when explaining the formulas, we used the TradingView platform , on which you can build Pivot Points using the built-in indicator. This can also be done on a live chart for binary options . To add an indicator, click on the “Indicators” button and enter “pivot points” or “pivot points” into the search bar if you have the English version. From those found, select “Standard Pivot Points” or “Pivot Points Traditional” for the English version:
Pivot Points will be immediately plotted automatically on the chart. Traders have a choice of all the previously discussed types of Pivot Points, which can be selected in the indicator settings. Additionally, each of the Pivot Points can be customized by making changes to the construction types, display for the past period, time frame, color and type of lines:
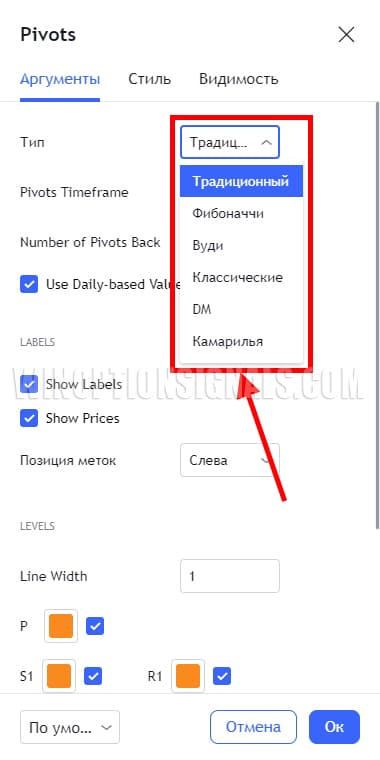
By default, TradingView has automatic plotting parameters for the timeframe (Pivots Timeframe). If desired, you can choose any of the time frames if, for example, you need lines for five or fifteen minutes.
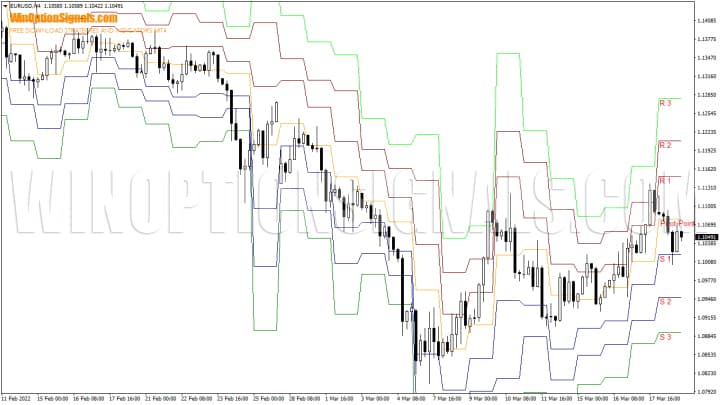
Pivot levels indicator for MT4: Pivot Points AiO
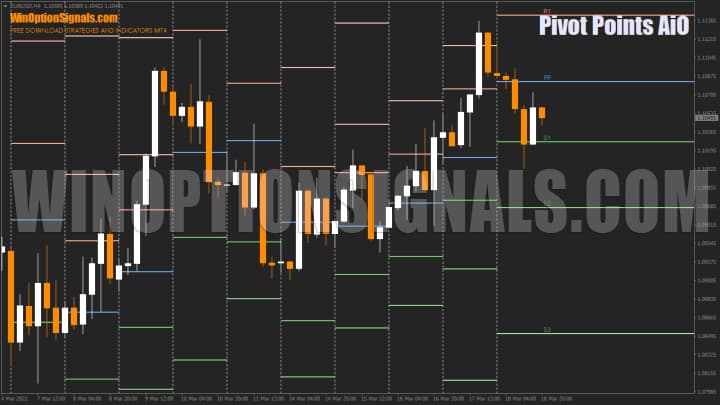
The MetaTrader 4 terminal also allows you to use indicators that build exactly the same Pivot Points. There are a lot of indicators for pivot levels, but not all of them allow you to build lines according to the formulas we described. One of the indicators that allows you to do this is Pivot Points AiO:
The indicator can be customized using the Fibonacci, Camarilla, Woody and standard formulas, but there is no DeMark formula for calculation:
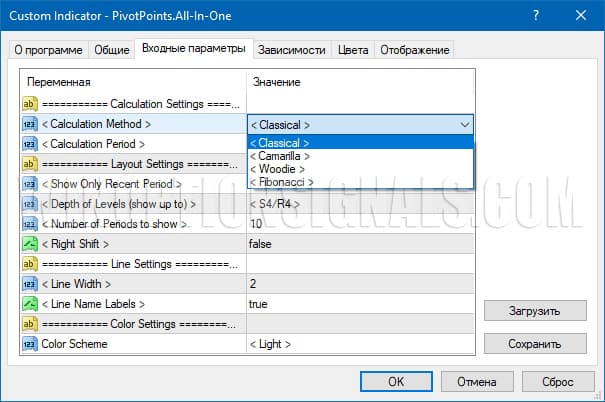
You can also customize timeframes, level depth, appearance and color scheme. When setting up the indicator, you should take into account that the calculation procedure changes depending on the selected timeframe. In particular, the period for which data is taken for calculations changes. Therefore, for most binary options strategies that are used intraday, it is worth selecting the “Hourly” (hourly) timeframe in the settings:
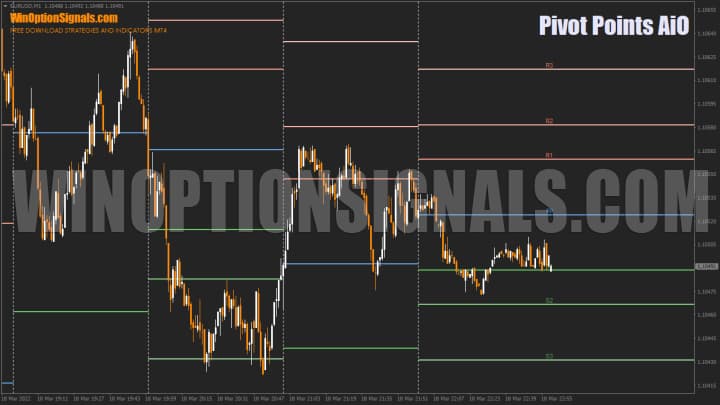
If you leave "Daily" (daily), then the Pivot points will be far from each other. But such a period for calculation, on the contrary, is suitable for those who trade on a time frame of H1 and higher.
You can download the pivot levels indicator at the end of the article.
Pivot levels: how to trade
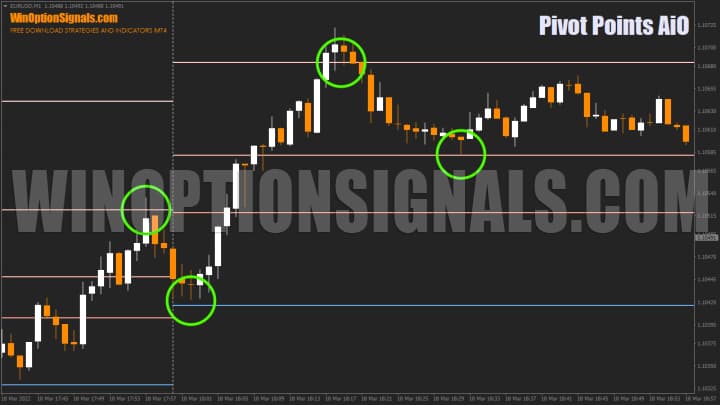
Pivot levels are used to determine support and resistance zones (or supply and demand). In both cases, the tool helps to determine the area on the chart, upon reaching which the price can change the current direction to the opposite. Pivot Points are used as a line, the intersection of which gives a strong signal for a reversal.
The above screenshot clearly shows the effectiveness of this approach. Quotes for the selected asset react well to established support and resistance zones. But in case of a breakout, the price movement strengthens and the trend goes in the same direction. That is, in such situations, transactions are opened following the direction of the market, and the previous lines become “mirror” (support becomes resistance, and vice versa):
Pivot Points can also be used as supply and demand zones. To do this, you need to combine two lines into one zone:
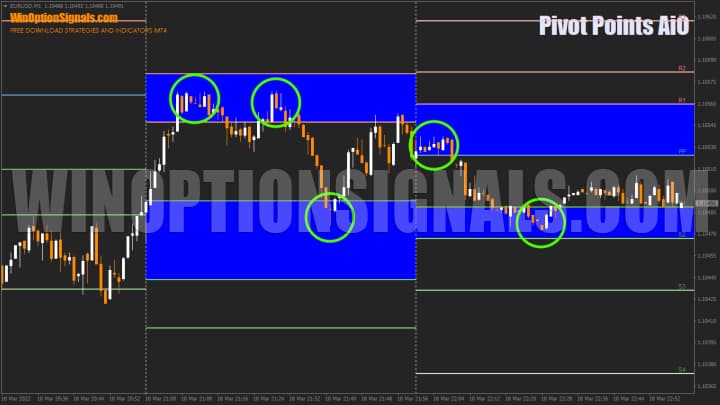
The option using zones is only suitable for experienced binary options traders, since they are difficult to determine and you need to have an understanding of how each asset behaves. For beginners, it's best to just use Pivot lines.
Not everyone will be able to use levels alone, since very often the price makes false breakouts or even breaks through the level, as if it does not exist. Therefore, for more effective trading, it is worth using additional indicators for binary options. In our case, we use the Stochastic Oscillator indicator together with Pivot Points.
The buying rules for Call options are as follows:
- The price must approach the line from bottom to top and go beyond it or touch the level, after which it begins to move down and consolidate behind the level (the candle must close below the level).
- Stochastic should enter the overbought zone and begin to exit it.
For Put options:
- The price must approach the line from top to bottom and go beyond it or touch the level, after which it begins to move upward and consolidate behind the level (the candle must close above the level).
- Stochastic should enter the oversold zone and begin to exit it.
Expiration in both cases should be five candles.
You can also use breakouts of Pivot lines to trade binary options, but in this case you also need to use an additional filter that will help determine the accuracy of a potential breakout. It is worth noting that the breakout strategy is more complex and very often the signals in it are false, so it is better to focus on rebounds from Pivot Points.
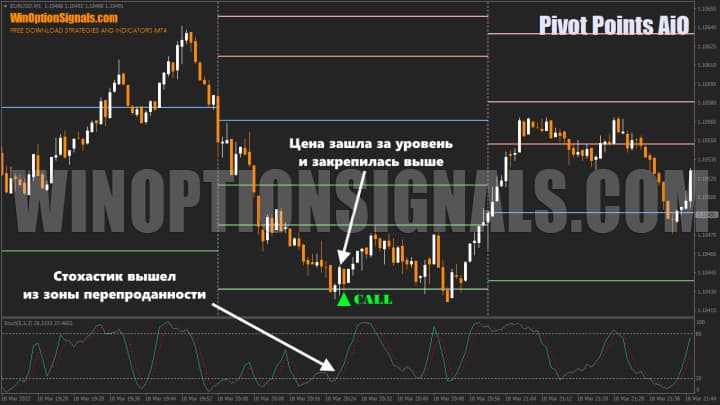
Opening a Call Option
In the example below, the price went beyond the level from top to bottom and settled above it. At this moment, Stochastic began to leave the oversold zone, which gave a signal to buy a Call option:
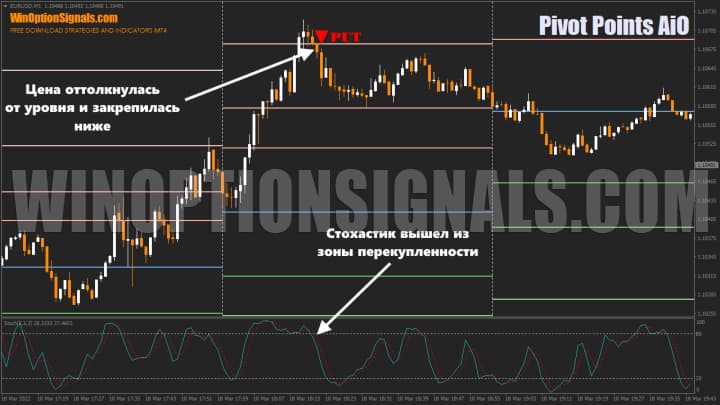
Opening a Put option
The opposite situation is where the price went beyond the level from bottom to top, after which it dropped and consolidated below it. Stochastic began to leave the overbought zone, which gave a signal to buy a Put option:
Conclusion
Trading at pivot levels is carried out on the principle of trading from support and resistance lines or supply and demand zones. However, this tool is not recommended to be used alone, since Pivot Points can often show a false breakout, which cannot be determined in advance. Also, pivot levels are not able to replace standard support and resistance lines, since they are constructed differently. They can be used together for greater efficiency.
Before each transaction, it is recommended to conduct a full analysis on history and on a demo account , and do not forget about the rules of money management and risk management , as well as trade only through a trusted broker, which can be found in our rating of binary options brokers .
Download the Pivot Points AiO indicator
Can't figure out how this strategy or indicator works? Write about it in the comments to this article, and also subscribe to our YouTube channel WinOptionCrypto , where we will definitely answer all your questions in the video.

See also:
Psychology in trading - what does a beginner need to know?
How to make money on binary options
To leave a comment, you must register or log in to your account.