This time we will look at a strategy for those who strive for the most perfect trades. It allows you to give accurate binary options signals, while having a small number of indicators. Therefore, this strategy is easy to master and can be applied to a wide variety of market conditions. For novice traders, there is a semi-automatic indicator that produces ready-made signals. This fact allows you to immediately begin testing the historical data system.
Parameters of the "Exact Entry" strategy
- Working platform: MetaTrader 4
- Tradable currency pairs: no restrictions
- Optimal timeframe: from M15 to H1
- Suitable option expiration date: one candle
- Time for trading: main trading sessions of European and American exchanges, except for news release periods.
- Recommended brokers: Quotex , PocketOption , Alpari, Binarium .
Strategy indicators
The “precise entry” strategy includes several analysis methods at once. Let's consider each of them in order.
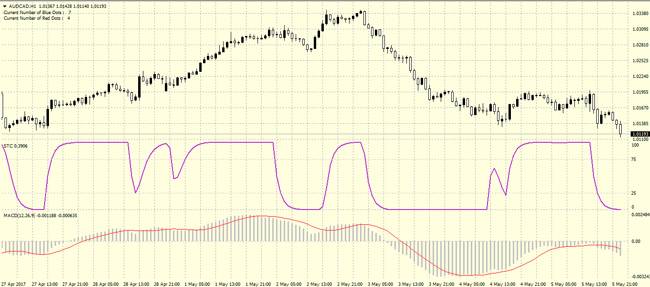
1) STC, aka Schaff Trend Cycle. This indicator is built on the assumption that market fluctuations have cycles of acceleration and decay. It is based on the Stochastic Oscillator and MACD , which has two exponential MAs (with periods of 23 for the fast one and 50 for the slow one). The difference between these averages is smoothed twice using the Stochastic algorithm.
MACD usually lags a lot in determining entry points. At the same time, STC notices rising and falling trends quite quickly. This difference between indicator signals can be large.
2) Parabolic SAR – refers to trend indicators. According to the current trend, Parabolic marks points on the opposite side of the chart. Thus, during a growing trend, dots will appear below the price, and during a downward reversal, they will appear above. If the price crosses the last point as a result of a reverse movement, the position of the parabolic changes. Such a signal indicating a possible change in trend perfectly complements our strategy.
3) AO and AC. These instruments are oscillators that display the acceleration or deceleration of trends. Each of them has its pros and cons, which can be balanced by combining these indicators in a pair.
4) STC system arrow. This component shows signals to open a position using arrows. If you do not intend to change the basic rules of the system, then you can remove all indicators from the chart except this one.
Strategy signals for binary options
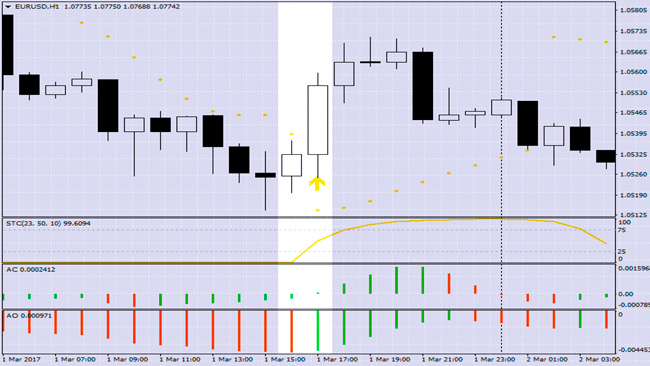
You should buy a Call option when:
- STC quickly crosses level 25 from bottom to top;
- Parabolic Sar flips under the price chart;
- The AO and AC indicators are green.
You need to buy a Put option when:
- STC quickly crosses level 75 from top to bottom;
- Parabolic Sar flips to a position above the price chart;
- The AO and AC indicators are colored red.
A more reliable signal to enter via STC can be obtained if you pay attention to the behavior of the indicator in the extreme zones. In the right situation, its line will fluctuate at maximum or minimum values for a very long time. Then, when a signal occurs, the indicator makes a quick movement in the opposite direction, i.e. crosses 75 from above (condition for selling) when a fall begins or 25 from below (condition for buying) when an upward trend begins.
A position should be opened after the candle on which the signal occurred closes. In other words, if the STC arrow is displayed on the chart, we buy a suitable option on the next candle.
The option duration is selected in accordance with the timeframe based on one candle. For a watch - 60 minutes, for M15 - 15, etc.
Examples of transactions
Due to the large number of entry conditions (from several indicators), this strategy does not produce signals often. In order not to wait for the system to trigger on one instrument, it makes sense to monitor several currency pairs at the same time. It is also worth activating the sound alarm in the STC system arrow, which can protect you from missing an input if you are away from the computer.
This trading system is better suited for large time frames. When working during such periods, the rate of profitable trades can rise to 80%. On smaller scales, for example, on M15, it will, of course, be smaller, but the number of signals generated will increase.
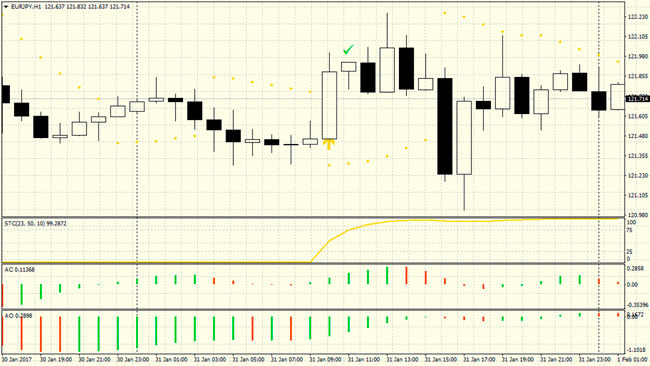
The figure below shows an example of an entry on the hourly chart of EUR/JPY. The next candle from the arrow is marked with a tick - exactly the one on which we opened the position. Judging by the market picture, the entry was not the best, but it paid off.
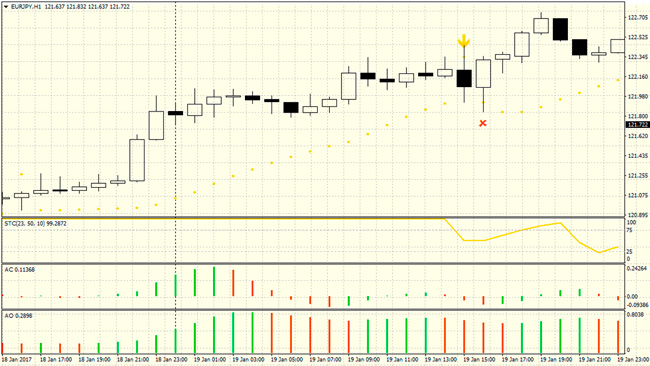
And the next screenshot shows an example of an unsuccessful trade against the trend. Of course, when trading using this system, the general trend must be taken into account. In this case, the presence of a strong growing trend negated the value of the sell signal from our indicator.
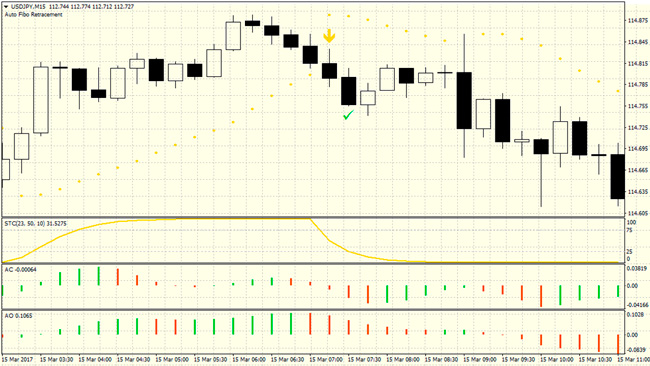
In the case where the direction of entry coincides with the direction of the general trend, the transaction can be very successful. Such an example is shown in the screenshot with a fifteen-minute USD/JPY chart.
Conclusion:
As you might guess, the most effective trading will be in accordance with the main trend of the instrument. Signals received on the sidewall work very poorly, since such movements do not have much prospects. You should also avoid trading times when important news may come out, as they can lead to completely unpredictable movements.
For trading, you should choose more volatile instruments, such as GBP/JPY or EUR/JPY. If you include the most liquid securities in your work, then you should trade them during the most active periods. This strategy can also be supplemented with the ATR indicator, which will help assess the increase or decrease in volatility.
Download strategy files "Precise Entry"
Can't figure out how this strategy or indicator works? Write about it in the comments to this article, and also subscribe to our YouTube channel WinOptionCrypto , where we will definitely answer all your questions in the video.




To leave a comment, you must register or log in to your account.