The standard tool for MetaTrader4 has gained considerable popularity among users, since its signals are simple and unambiguous both for entering the market and for closing a position. Taking into account the positive experience of using it for Forex trading, the indicator was refined and adapted for binary options in such a way as to create a full-fledged strategy.
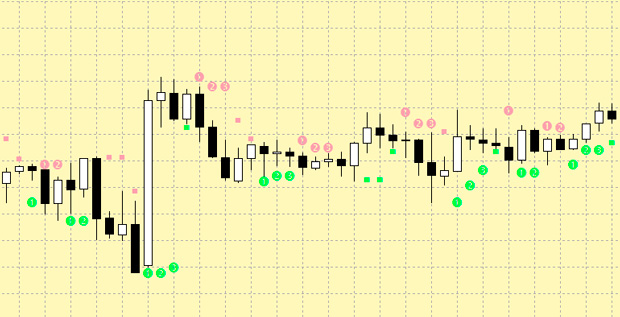
The redesigned version of Parabolic SAR has a lot in common with its “prototype”. It also informs about a change in trend using points above or below the chart, however, signal candles are numbered (1-3), this is necessary to identify reversal patterns.
Indicator characteristics
The modified PSAR is intended for loading into the MT4 trading terminal.
Recommended currency pairs: volatile.
Expiration time: 1 candle
Timeframe: any
Trading session: any of the trader’s choice
Recommended brokers: Quotex , PocketOption , Alpari, Binarium .
Instructions for installing indicators in MetaTrader 4:
The main idea of the strategy is this: an option is purchased when numbered candles appear. They stand out when quotes break through the parabolic level. The most important signal for binary options is the candle marked “1”; if you see it, immediately enter the market in the appropriate direction. If the bet turns out to be profitable, we do not pay attention to the next candles. In case of a loss, we open further transactions taking into account the recommendations of the Martingale method , focusing on the marks “2” and “3”.
How to make deals
Algorithm for purchasing options using a trading strategy:
- We are waiting for the main signal to appear - candle number “1”. We purchase a contract for a minimum amount. If the dot is green - Call, red - Put. Expiration time is 1 candle. For example, if the timeframe is M30, then the expiration period is also 30 minutes.
- A. The bet is “in the money.” We conclude the next deal when a candle marked “1” appears;
- B. The option is unprofitable. We are waiting for the second numbered candle to appear.
- On the candle marked “2” we buy a contract for double the amount in the same direction as the first one, with a similar expiration period. If the second signal candle does not appear due to a change in trend, we wait for the first one to form again.
- A. The bet is successful. We received a small income.
- B. Loss again. We wait for the third signal candle and enter the market.
- When a candle marked “3” appears, we increase the bet by 2 times compared to the previous deal. The third candle may not appear if the direction of price movement has changed.
- A. The contract is profitable.
- B. The deal is unsuccessful. We watch the chart until the first signal candle appears. We place a bet on the minimum amount.
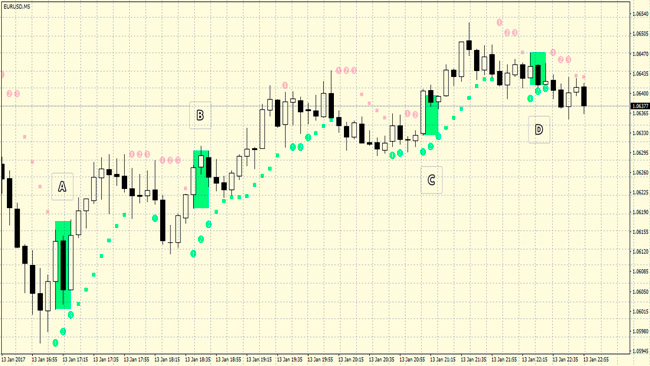
A set of points 1-2-3 is a pattern that informs about a reversal. This is a common pattern that signals a change in trend, so there is every chance that after the third candle the movement in the given direction will continue.
Watch the chart carefully and you will easily understand whether the dominant trend will continue.
Example A. Candles: 1. rising; 2. descending. 3. long ascending - signals a powerful upward movement.
Example B. 1-2-rising candles. 3. downward, breaking the low of the previous candle. This suggests that a weak upward movement is likely.
Example C. Candles: 1. ascending. 2. "bearish". 3. “bullish” - indicates the emergence of an upward impulse.
Example D. 1. bullish candle. 2. downward, demonstrates a decrease in price below the previous low. 3. “bull”, has a short body and a long tail. Signals weak potential for ascension.
If desired, the strategy can be adjusted to suit your preferences. Since it is trendy, it is better to use an additional filter. For example, a moving average is suitable for this, which will help to reject an obviously flat period.
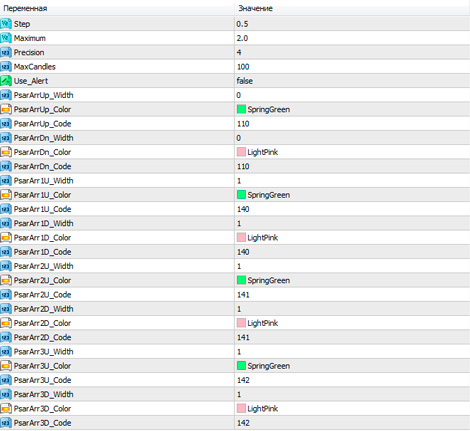
Parabolic PSAR indicator settings
Since the “model” for the modified instrument is the standard PSAR, the settings of these two indicators are largely similar.
Settings affecting the visual highlighting of indicator icons. There are 3 types:
- *_Width – line width;
- *_Code – number from the “Wingdings” type font.
- *_Color – color;
Basic indicator settings
- ID – the name of the indicator itself.
- MaxCandles – number of candles for calculating instrument values.
- Step – Parabolic step (optimally - 0.1618).
- Maximum – largest Parabolic step (recommended value - 0.2)
- Precision – an option on which the accuracy of calculations depends (standard value is 6).
- Use_Alert – appearance of a notification about the signal. The direction of the transaction, the name of the asset and the TF are written in the window.
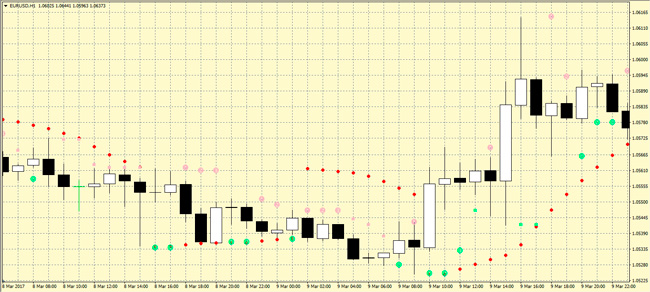
The principle of calculating the values of the PSAR indicator is almost identical to the standard one. This can be clearly seen if you overlay both indicators simultaneously on a chart and compare their display. In the graph below, the points of the unmodified version are indicated in bright red.
Examples of using the modified PSAR in binary options
We will need a strategy tester for binary options , invented by the author of the indicator, known on the forums under the nickname MTH2014. The whole difficulty is that the signal does not appear at the opening of a new candle, but during the process of drawing it, so the indicator cannot be checked on history.
The tester models the behavior of the real market as accurately as possible, so it will be especially useful in this case.
So, the initial data: the minimum bet amount is $10, the option profitability is 75%. If the direction is correct, the profit will be $7.5. If the first transaction is unsuccessful, and the second one, concluded using Martingale (with doubling), is profitable, then the income will be equal to $5 (loss - $10, income - $15). After the third trade, the trader will be at zero, having an income of $30 with a bet amount of $40. In the worst case scenario (three consecutive non-winning contracts), the damage will be $70, i.e. $10 + $20 + $40.
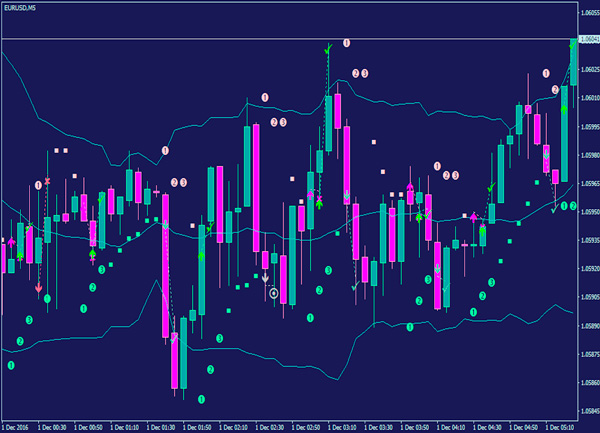
Below is the result of testing the strategy under these conditions:
- asset - EURUSD pair;
- trading time is night;
- time period: 5 minutes;
Total income is $120, loss is $60. The ratio of winning to losing bets is 2:1.
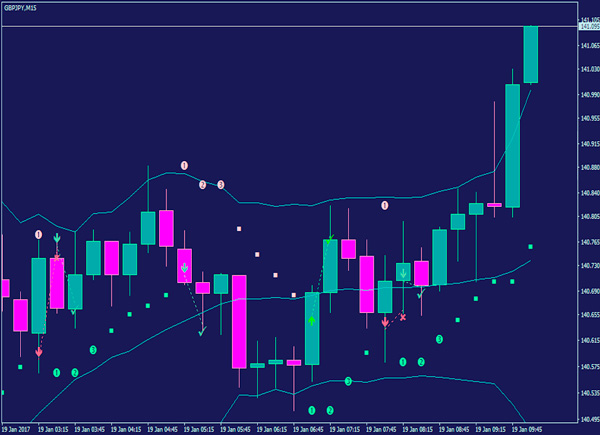
Another visual demonstration of the strategy’s capabilities was carried out taking into account the following data:
- trading asset - GBPJPY;
- timeframe - M15.
A series of bets on the system brought $25, confirming the high profitability.
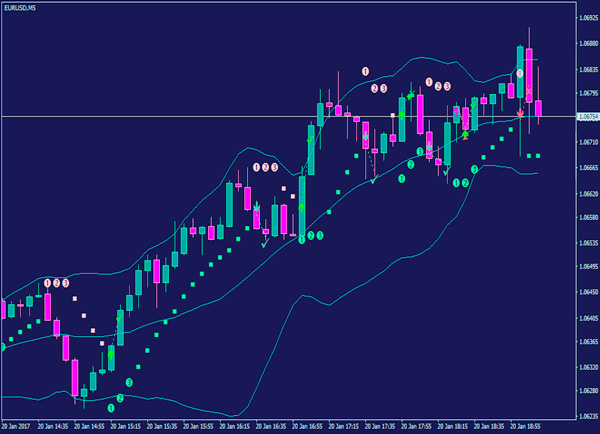
Practice shows that in order to “lose” a lot of money using this strategy, you need really extremely unfavorable conditions. To test the system in such a situation, we chose the EURUSD asset, which clearly shows a very strong trend. It turns out that one of the important factors that ensures an effective result is such market dynamics, in which multidirectional signals alternately arise.
The graph below confirms this thesis. The more stable the trend, the lower the positive effect. The EURUSD pair behaved relatively peacefully, so the size of the profit turned out to be satisfactory, the profit factor was equal to 3.
Conclusion
The modified PSAR (Parabolic Stop And Reverse) indicator, which means “parabolic stop and reversal”, is an excellent choice for options trading. It is as convenient as possible thanks to high-quality visual design. The tool also has flexible settings. Signals allow you to find the right moment to enter the market. When buying an option on the third candle, you do not have to double your bet. We use Martingale only when there is a significant trend impulse, having a fixed number of “knees”.
Download PSAR indicator
Can't figure out how this strategy or indicator works? Write about it in the comments to this article, and also subscribe to our YouTube channel WinOptionCrypto , where we will definitely answer all your questions in the video.
See also:


To leave a comment, you must register or log in to your account.