The Trend Wave Oscillator indicator for binary options perfectly determines the direction of the price impulse. As the name suggests, traders use it to ride the wave of a trend. Moreover, this tool gives fairly accurate signals, both in the direction of the dominant trend and against it.
The indicator for binary options Trend Wave Oscillator is capable of determining the direction of trade itself, as well as forming overbought and oversold zones, which are very popular among traders. The developers ask $30 for the opportunity to use this multifunctional tool in their strategies. The amount is small, but we’ll figure out whether it’s worth spending in this review.
Content:
- Characteristics
- Installation
- Overview and Settings
- Trading rules for Trend Wave Oscillator
- Opening a Call Option
- Opening a Put option
- Conclusion
- Download Trend Wave Oscillator
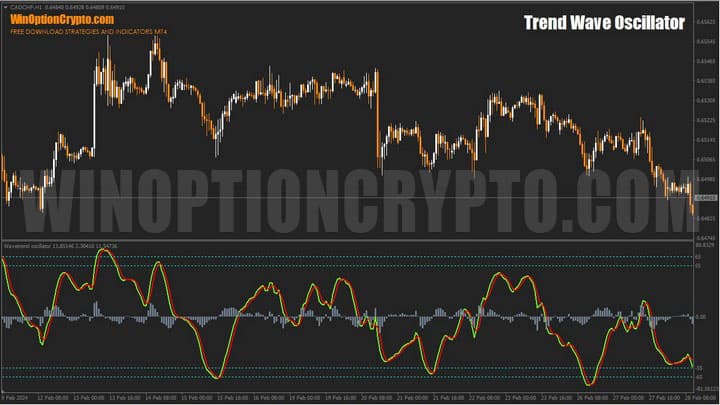
Characteristics of the Indicator for Binary Options Trend Wave Oscillator
- Terminal: MetaTrader 4
- Timeframe: H1
- Expiration: 3 candles
- Option Types: Call/Put
- Indicators: TrendWaveOscillator.ex4
- Trading instruments: currency pairs , commodities, cryptocurrencies , stocks
- Trading time: 8:00-20:00 Moscow time
- Recommended brokers: Quotex , Pocket Option , Alpari, Binarium
Installing the Indicator for Binary Options Trend Wave Oscillator
The Trend Wave Oscillator indicator is installed as standard in the MetaTrader 4 platform. To do this, you need to add it to the root folder of the terminal by selecting “File” in MT4 and then “Open data directory”. In the directory that opens, you need to go to the “MQL4” folder and then to “Indicators”, and then move all the files there. Templates are installed in exactly the same way, but are placed in the “templates” folder. For more detailed installation instructions, see our video:
Review and Settings of the Indicator for Binary Options Trend Wave Oscillator
The indicator for binary options Trend Wave Oscillator is another oscillator conveniently located under the price chart. This situation is not accidental and is due to the need to use a scale separate from the financial instrument. While a currency pair , stock or cryptocurrency can have any value, our “basement” oscillator can only take values from 0 to 100. Because of this feature, it and all other oscillators are placed in a separate window, called the “basement” in trading jargon "
As for the term “oscillator” itself, it comes from the Latin oscillare (to swing). Wave Trend “swings” from its lower boundary to the upper, analyzing the differences between the maximum and minimum prices, as well as their initial and final values for a certain period. Detected deviations are displayed as a line wrapped around the central zero mark.

For example, when highs in a new trading period are higher than previous highs, or when closing prices are near the top of a range, this may cause the instrument to display high or rising values. This may indicate the presence of a growing trend or the formation of an overbought zone.
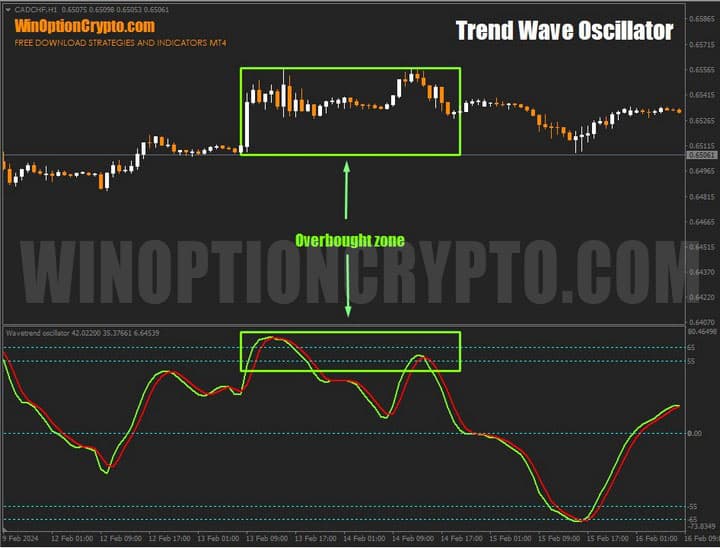
The Trend Wave Oscillator binary options indicator itself consists of two curves with a histogram marked on them and two additional horizontal straight lines of overbought and oversold zones.
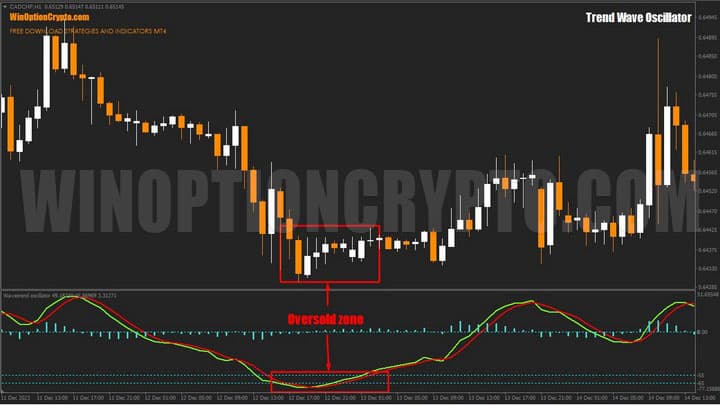
A fairly standard view of the oscillator, with the exception of the added histogram, designed to help traders visually track the intersection of the main and signal lines.
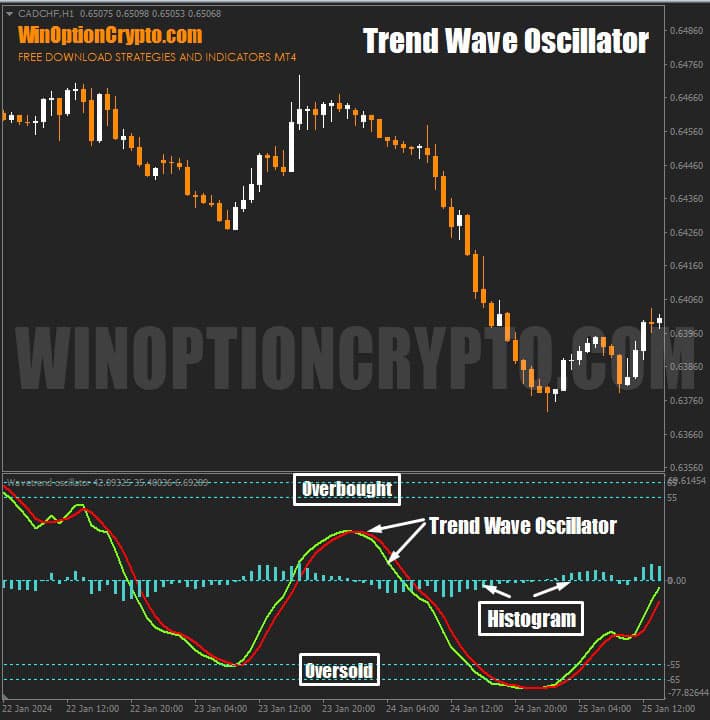
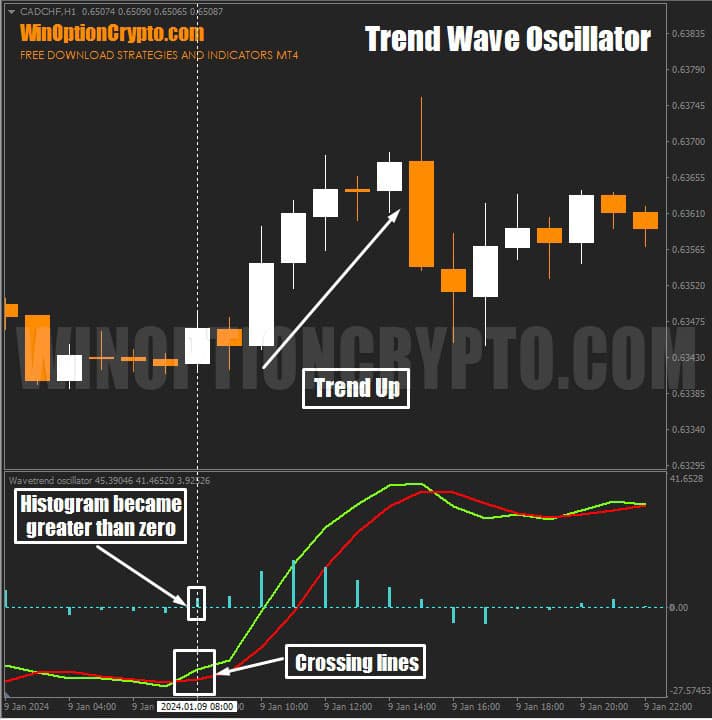
A crossover typically anticipates price growth or decline. For example, the figure below shows an example of the resumption of growth in quotes after a correction, which ended with the crossing of signal lines and the histogram moving into positive territory.
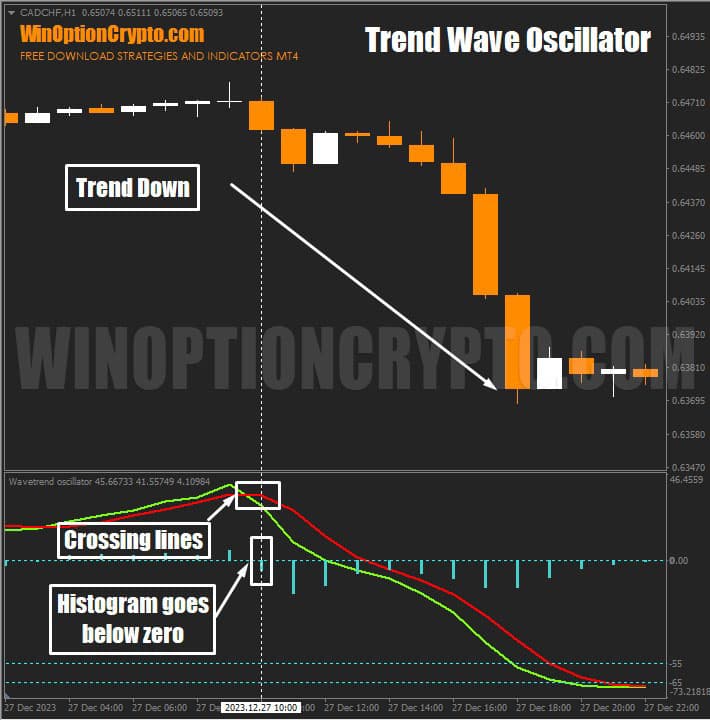
The situation looks similar in the case of price reductions. In such circumstances, the trader should wait until the Wave Trend indicator crosses and the bar histogram moves into the negative zone.
This oscillator has very few settings, and even a complete beginner will immediately understand them. There are only two main parameters:
- Channel Length – estimates short-term momentum
- Average Length – averages prices over a longer period

To visually assess how much these parameters influence the formation of signals, let’s add a trend wave with different settings to three different charts.
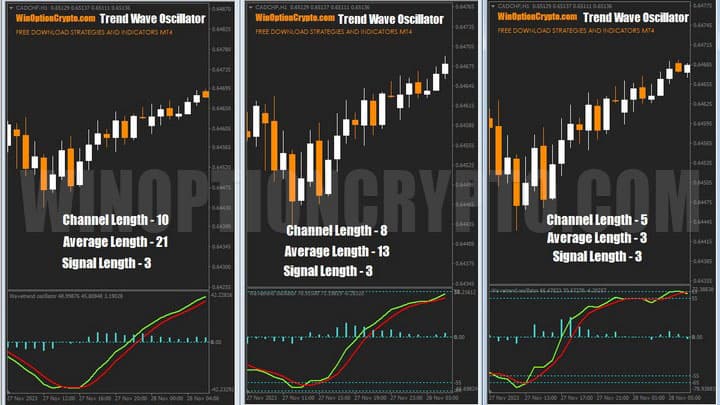
It is noticeable that the smaller the specified parameters, the more sensitive the oscillator becomes to price changes. It’s worth taking note of this when you adjust this tool to your trading style. In order to understand how the Signal Length parameter affects the charts, let’s install an indicator with the same parameters, except for this one.
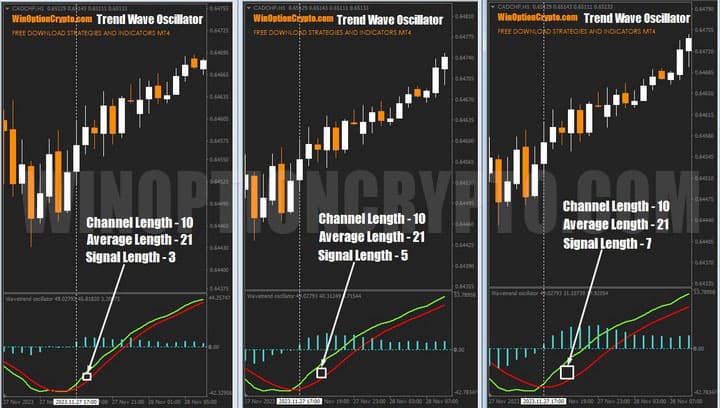
As you can see, the Signal Length value does not affect the intersection of the Wave Trend indicator. This parameter only specifies the offset of two lines relative to each other. The higher the value, the greater the offset.
The last parameters in the settings block determine the overbought and oversold levels. They will be different for each time frame and currency pair. It all depends on the degree of volatility of a particular financial instrument and the time interval on which the analysis is carried out.

Visually on the chart, these levels are highlighted by horizontal dotted lines, indicating the boundaries of the “normal trading range”, beyond which the quotes are more likely to stop moving in the same direction and, at a minimum, a correction will begin or a change in exchange rate dynamics will occur.

We will talk in more detail about the rules for opening transactions in the next section.
Trading Rules Using the Indicator for Binary Options Trend Wave Oscillator
The Trend Wave Oscillator indicator for binary options does an excellent job of identifying large (by the standards of the selected timeframe) price fluctuations. It will certainly be appreciated by supporters of the Elliott wave theory - the concept of determining market dynamics through the prism of visual models, called waves in this technique.
Traditionally, we do not recommend blindly using the signals of any instrument. The disassembled oscillator is no exception in this sense. Any intersections of its signal lines must always be coordinated with the main direction of price movement. The only limitation of this rule is conscious trading in a range that arose for fundamental reasons: a sideways trend (flat) in the Asian session for European pairs or prolonged consolidation due to the accumulation of positions by major players.
However, we will assume that we are trading within the main trend. And a selection of articles specifically devoted to this topic will help us in understanding this approach:
- How does a trend work in markets?
- Identifying and using bullish and bearish trends.
- Market phase changes .
- How to determine a flat in the market?
Considering the above and understanding the importance of the ability to correctly determine trends in the market for trading results, let us turn to one of the best binary options trend indicators for help in this matter.
Trade with Ozymandias
This time, to determine the trend, we will use our old familiar trend analyzer, probably with the most poetic name on the site - Ozymandias . Why poetic? This was the name of a sonnet written by the early 19th century English poet Percy Bysshe Shelley.
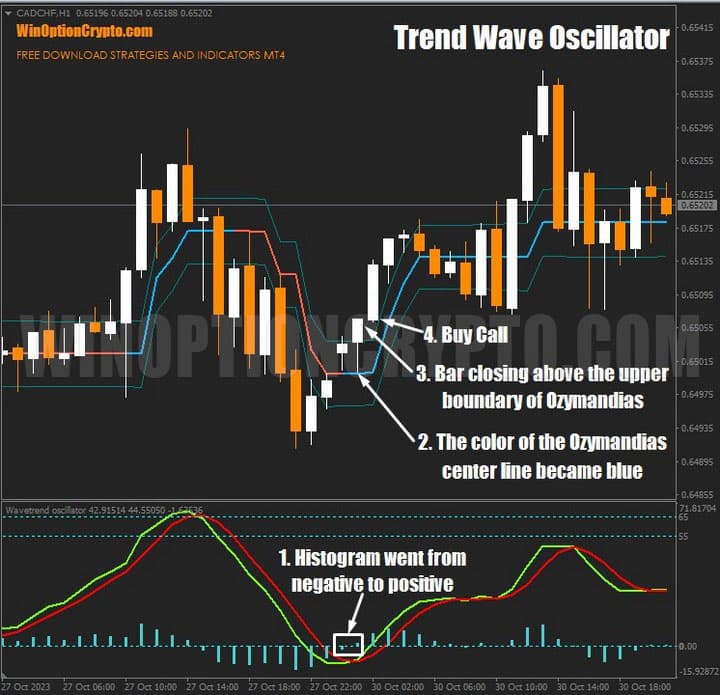
Rules for purchasing Call options:
- Wave Trend histogram moved from negative to positive territory
- Ozymandias center line color changed to blue
- The last bar closed above the upper limit of Ozymandias
- At the opening of a new time interval, open Call
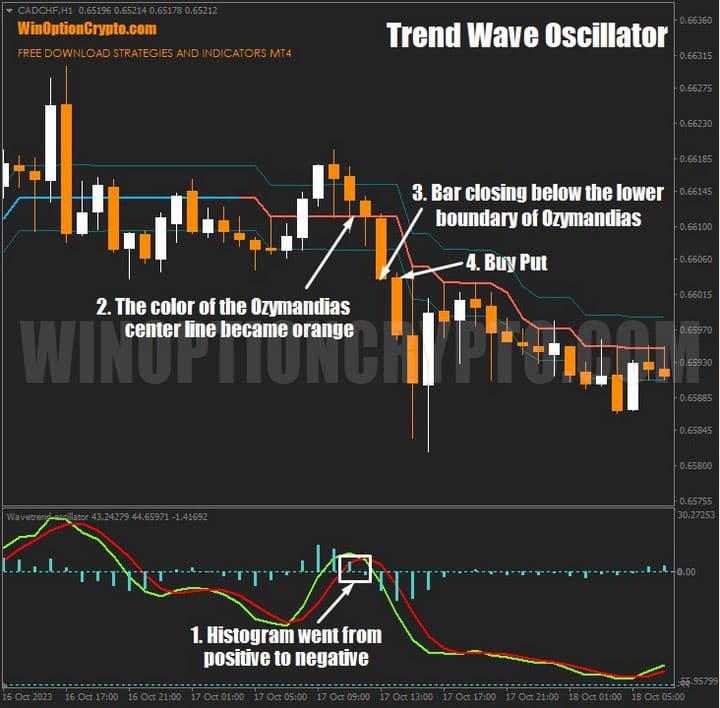
Rules for purchasing Put options:
- The Wave Trend histogram has moved from positive to negative territory
- Ozymandias centerline color changed to orange
- The last bar closed below the lower border of Ozymandias
- When a new time interval opens, open Put
Trading with CCI
In addition to all sorts of newfangled tools, the old time-tested CCI oscillator is also quite suitable for identifying trends. It has been in consistently high demand among more than one generation of traders for many years. Most people use it to assess the future direction of the market and determine the reversal of the trend, as well as detect the beginning of a price impulse in the opposite direction, but we will act differently and adapt this tool for trend trading.
To do this, instead of the traditional calculation period of 5 or 8 bars, we use the calculation of the commodity channel index for 89 bars (a number from the Fibonacci series).
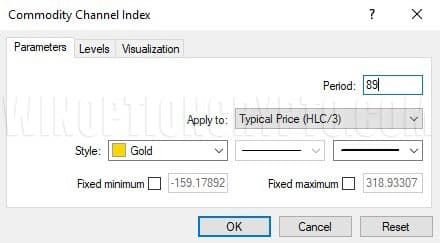
Then the CCI will look like the picture below. Please note that a value above zero indicates an upward trend, and a value below indicates a downward trend.
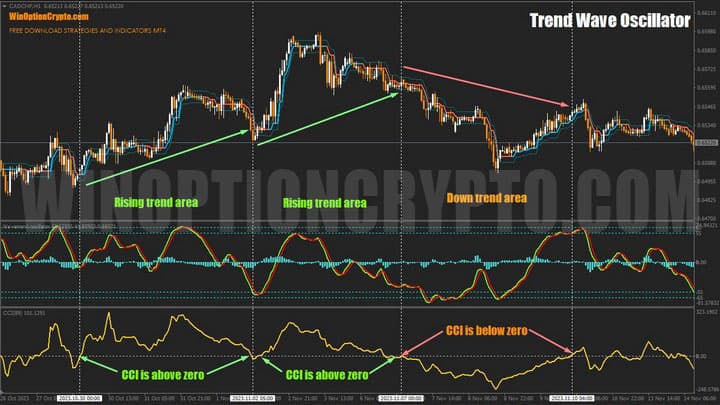
This will be a filter when determining when a deal is concluded.
Rules for purchasing Call options:
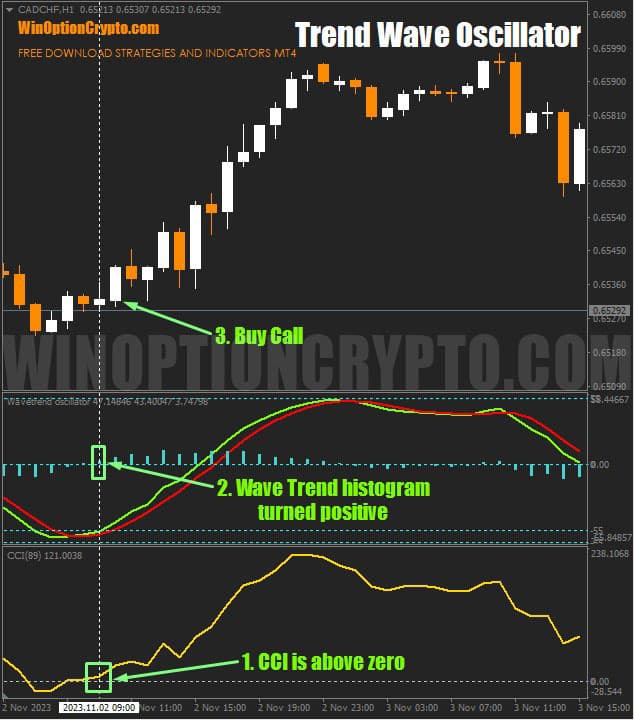
- CCI above zero
- The Wave Trend histogram has moved into positive territory
- At the opening of a new time interval, open Call
Rules for purchasing Put options:
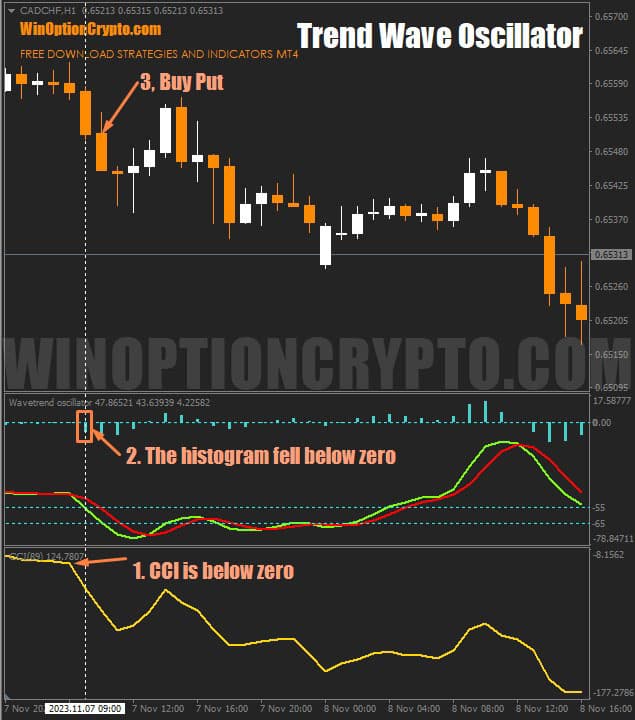
- CCI below zero
- The Wave Trend histogram has moved into negative territory
- When a new time interval opens, open Put
Opening a Call Option
CCI readings are above zero and the Wave Trend histogram has moved into positive territory. We buy a Call at the opening of a new interval with an expiration of 3 candles.
Opening a Put Option
The CCI indicates a downward trend as its readings are below zero. The Wave Trend histogram has moved into negative territory. At the opening of a new candle, we buy Put with an expiration of 3 candles.
Conclusion
The Trend Wave Oscillator binary options indicator can be an excellent assistant in determining the moment of emergence of a new price impulse. At the same time, it, like many other oscillators, has not only advantages, but also disadvantages. These include the presence of false signals and the ambiguity of some of them.
However, by using techniques for determining the main trend, you can filter out most of the false signals and fully enjoy the positive qualities of this instrument. First of all, visibility, a wide variety of entry points and trading methods built on its basis. Secondly, the advanced nature of the information that this binary options oscillator provides to the trader, as well as the possibility of flexible adjustment to a specific currency pair.
Note that this basement oscillator is fairly priced by sellers, and for its $30 it gives quite a lot of good signals. Before buying it, we offer you to download it for free from our website for informational purposes. Try opening several transactions with it on a demo account , following the rules of risk management and money management . Only after receiving sustainable results, proceed to real trading. We wish everyone profitable transactions.


To leave a comment, you must register or log in to your account.