
The TDI binary options indicator is one of the universal trend oscillators. Thanks to its signals, financial market traders can determine the most likely direction of movement of quotes, which will take place in the very near future, and based on this, make transactions with Call or Put binary options.
This trader's assistant is based on the popular RSI indicator. With its help, TDI determines the strength of the trend while a special algorithm levels out market noise, and built-in Bollinger bands help to correctly assess the amplitude of exchange rate fluctuations. As a result, the investor receives a clear picture of what is happening in the instrument being traded. The versatility of this oscillator allows it to be effectively used in conjunction with other technical analysis tools and complement a wide variety of trading strategies.
Content:
- Characteristics
- Installation
- TDI overview and settings
- TDI Trading Rules
- Opening a Call Option
- Opening a Put option
- Conclusion
- Download TDI indicator
Characteristics of the indicator for binary options TDI
- Terminal: MetaTrader 4 ;
- Timeframe: M15;
- Expiration: 6 candles;
- Option types: Call/Put;
- Indicators: TDI-With_Alerts.ex4;
- Trading instruments: currency pairs , commodities, cryptocurrencies , stocks;
- Trading hours: 8:00 – 20:00 Moscow time;
- Recommended brokers: Quotex , Pocket Option, Alpari, Binarium.
Installing an indicator for binary options TDI
This oscillator does not have any special features when installed in the MetaTrader 4 platform. Everything happens as standard. We add it to the root folder of the terminal by selecting “File” in MT4 and then “Open data directory”. In the directory that opens, you need to go to the “MQL4” folder and then to “Indicators”, after which we transfer the file with TDI there. Templates are installed in exactly the same way, but are placed in the “templates” folder. For more detailed installation instructions, see our video:
Review and settings of the indicator for binary options TDI
The indicator for binary options Traders' Dynamic Index (TDI) has a long history of successful use as part of a wide variety of trading strategies. They first started talking about it in the early 2000s. According to Dean Malone, the idea for its creation came to him in 2005, when he was working on the CompassFX project. Since then, the indicator has undergone more than one update. And today, despite its rather strange appearance, it is essentially a compilation of four independent indicators, united in one window by a common idea.
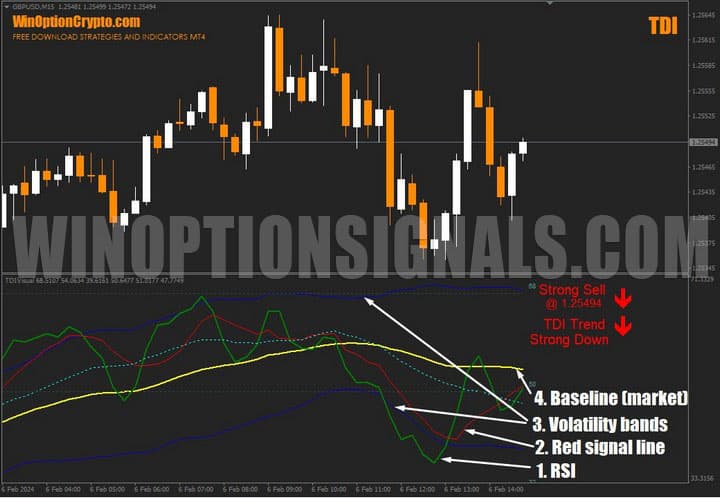
TDI components:
- RSI (Green line);
- Signal moving average (Red line);
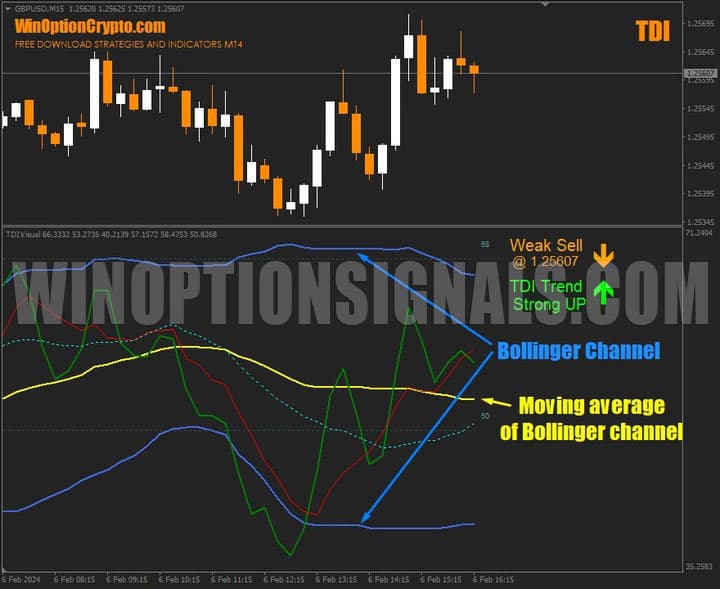
- Bollinger volatility bands (Blue bands);
- Basic moving average (Yellow market line).
Due to the fact that the indicator contains several fundamental ideas at once, it can be used as an independent trading system. He gained wide popularity in trading circles due to his ability to accurately determine the current state of the market. The indicator is located in the basement of the chart and has a set of standard settings.
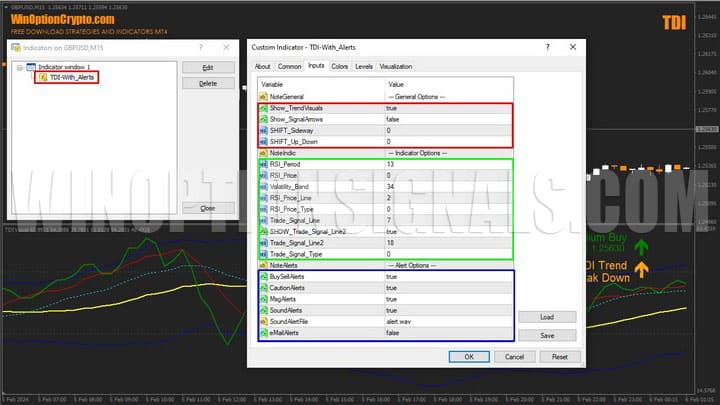
All parameters of its operation are divided into three standard blocks: general, indicator settings and alerts. In the general block, you can adjust the value offset and enable the display of signals on the instrument chart. In the indicator settings, as the name implies, the calculation periods for the TDI components - RSI (green line), Bollinger bands (dark blue bars) and the signal line (red) are specified.
It is important to note that the default settings have been thoroughly tested and back-tested. Therefore, they should be changed only in cases of extreme necessity and unsatisfactory results of work with standard settings.
The green line is the “fast” RSI of a short period, while the red line is the “slow” RSI of a longer calculation period
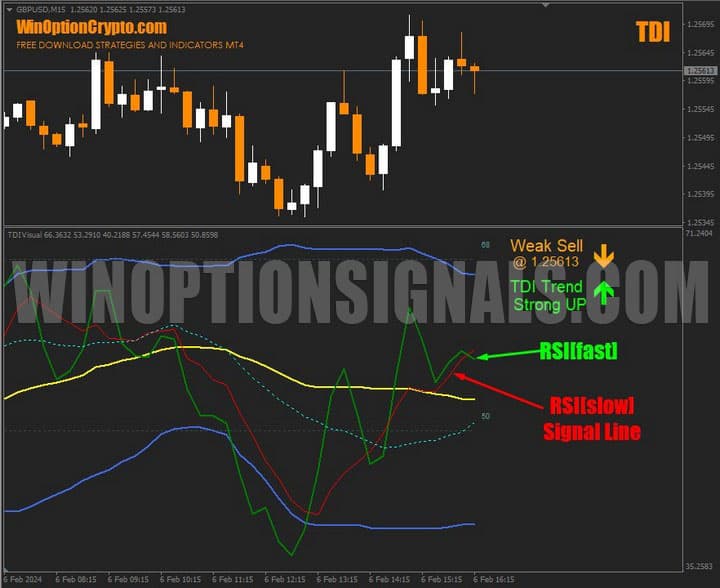
Dark blue Bollinger bands are plotted based on RSI values, and the yellow line is the moving average between the upper and lower boundaries of the volatility channel.
RSI Price value encoding :
0 = Close price [Default]
1 = Open price;
2 = High price;
3 = Low price;
4 = Median price, (high+low)/2;
5 = Typical price, (high+low+close)/3;
6 = Weighted close price, (high+low+close+close)/4.
Encoding of RSI Price Line values:
0 = Simple moving average [Default];
1 = Exponential moving average;
2 = Smoothed moving average;
3 = Linear weighted moving average.
- parameters can be substituted as input parameters RSI Price and RSI Price Line. Depending on the selected figure, the indicator values will be calculated at one or another price using a specific price smoothing method. But before changing the settings, we advise you to test the signals on history.
Trading rules using the TDI binary options indicator
The TDI indicator generates many effective signals for buying binary options. Trading with it will be more profitable during periods of unidirectional price impulses, as, indeed, with any trend trading system. Therefore, to use this oscillator, it is worth selecting assets that have high price volatility.
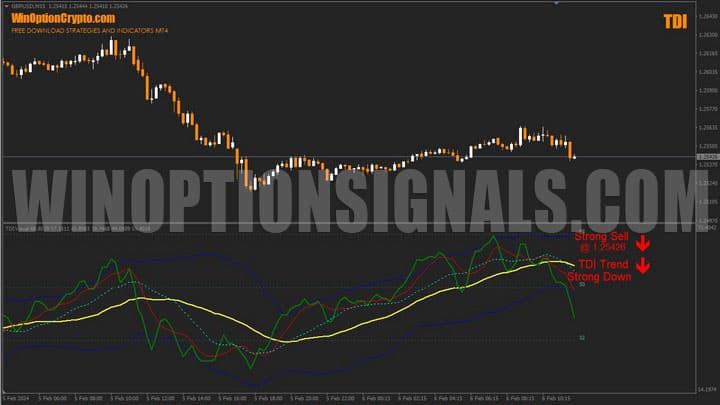
The main purpose of this tool is to show the direction and strength of the current trend. And having a good trend, it is no longer difficult to determine the moment of concluding a transaction to buy a binary option.
Trend direction.
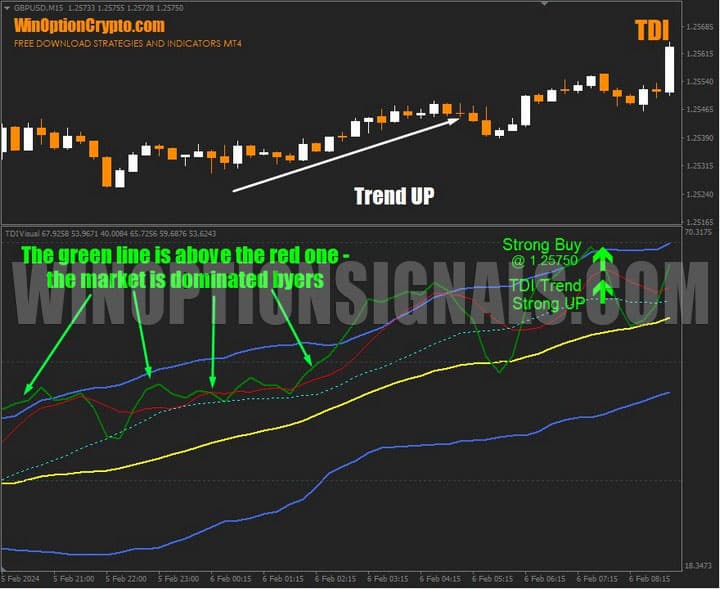
If the green line is above the red line, buyers dominate the market and we can talk about a rising price trend.
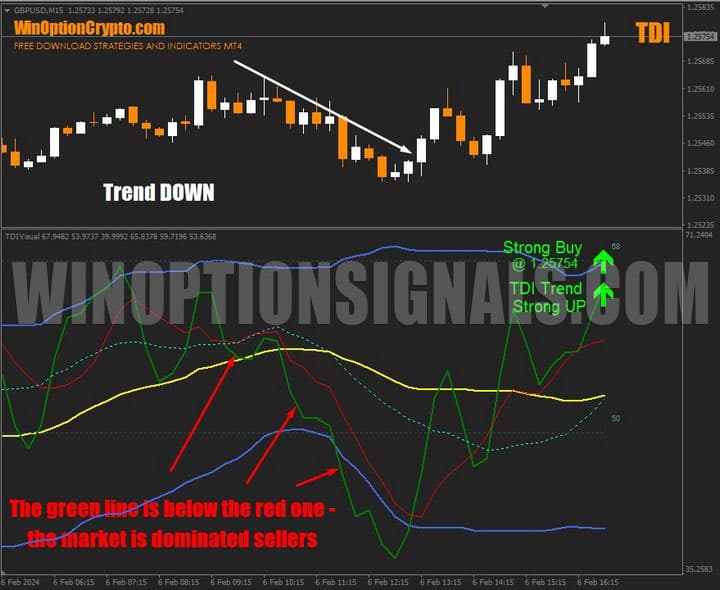
If the situation is mirrored and the green line drops below the red line, the market is controlled by sellers, which means a downward trend is not far off.
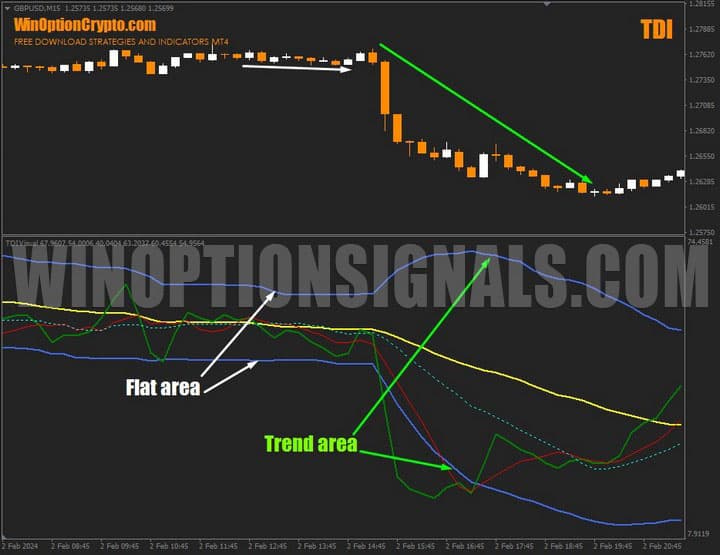
Volatility.
Bollinger Bands signal market volatility. If they narrow, the market is weak and traders should refrain from entering into transactions. In the opposite situation, when the bands diverge in different directions and prices show high volatility, it is necessary to increase trading activity.
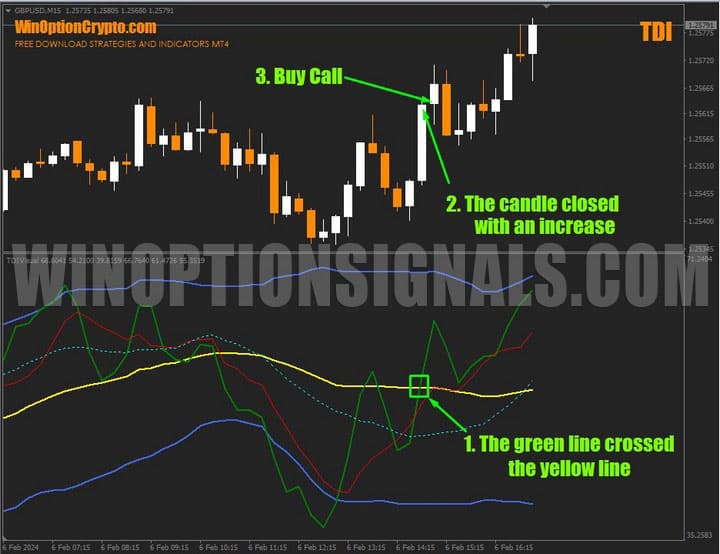
Basic rules for buying a Call
1. The green TDI line crossed the yellow moving average from bottom to top.
2. The candle where the crossover occurred is bullish.
3. At the opening of the next candle, we buy a Call option with an expiration of 6 candles.
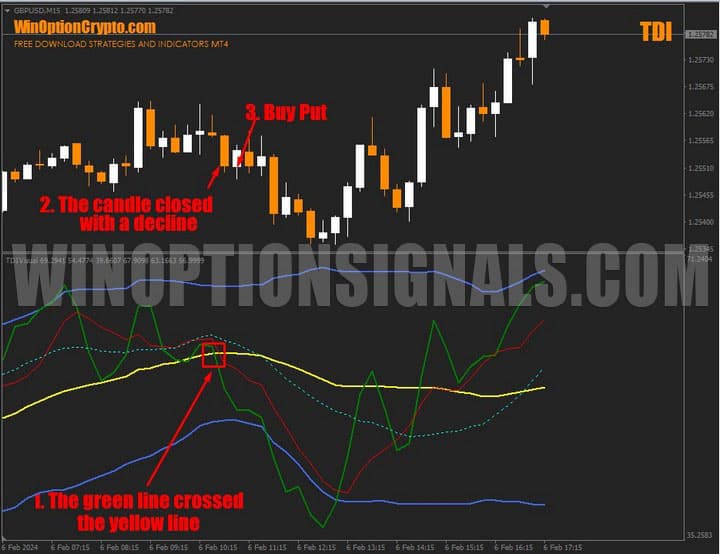
Basic rules for buying Put
1. The green TDI line crossed the yellow moving average from top to bottom.
2. The candle where the crossover occurred is bearish.
3. At the opening of the next candle, we buy a Put option with an expiration of 6 candles.
Opening a Call Option
The green TDI line crossed the yellow moving average from bottom to top. The candle closed higher. At the opening of a new candle, we buy a Call option.
Opening a Put option
The green TDI line crossed the yellow moving average from top to bottom. The candle closed down. At the opening of a new candle, we buy a Put option.
Conclusion
The TDI indicator can be used in various trading systems, including binary options scalping . Nevertheless, it will appeal not only to those who like to make quick transactions, but also to those who appreciate leisurely trading at a medium-term pace.
The author claims that this tool can produce up to 80% profitable trades. We are not so optimistic and will say that if you have the skills and knowledge to detect trends in a timely manner, this oscillator can undoubtedly be useful. It indicates very good moments for concluding transactions, but should be used in conjunction with various filters (including volatility) to increase the number of profitable trades. When trading binary options with him, try to avoid inactive currency pairs and flat markets, perform transactions only during active hours.
Before you start using it in real trading, be sure to check the operation of this tool on a demo account . Only after checking its results in practice, we advise you to switch to trading with trusted brokers . In this case, always use the rules of risk management and money management . We wish everyone a favorable trend!
Download binary options indicator TDI

See also:
Current bonuses and promotional codes for BO
To leave a comment, you must register or log in to your account.