
The Strong Trends binary options indicator is designed for impulse trading. According to the author of this development, Mike Semlich, with its help, traders can easily find transactions with a high probability of a positive outcome. As you know, the percentage of profitable transactions directly depends on the strength of the trend . Actually, this instrument evaluates this strength, making it possible to open a position on the first pullback in its direction.
A trend trader can make money only in conditions of unidirectional price movement, and this only appears when the “smart money” begins the distribution phase after accumulation (flat). We will tell you how to join the beginning price movement with minimal risks using the Strong Trends binary options indicator in this review. Please note that the full version of this tool costs $89. However, at the end of this article you can download it for evaluation purposes absolutely free.
Content:
- Characteristics;
- Installation;
- Review and settings;
- Trading rules for Strong Trends;
- Opening a Call option;
- Opening a Put option;
- Conclusion;
- Download Strong Trends.

Characteristics of the indicator for binary options Strong Trends
- Terminal: MetaTrader 4
- Timeframe: M15
- Expiration: 5 candles;
- Option Types: Call/Put
- Indicators: AutoTrendChannels.ex4
- Trading instruments: currency pairs , commodities, cryptocurrencies , stocks
- Trading time: 8:00 - 20:00 Moscow time
- Recommended brokers: Quotex , Pocket Option , Alpari , Binarium
Installing the indicator for binary options Strong Trends
The Strong Trends indicator is installed as standard in the MetaTrader 4 platform. To do this, you need to add it to the root folder of the terminal by selecting “File” in MT4 and then “Open data directory”. In the directory that opens, you need to go to the “MQL4” folder and then to “Indicators”, and then move all the files there. Templates are installed in exactly the same way, but are placed in the “templates” folder. For more detailed installation instructions, see our video:
Review and settings of the indicator for binary options Strong Trends
Before diving into the details of Strong Trends settings, let's understand how it works. The core idea behind trader Mike Semlich's creation in 2018 is that strong momentum is the key to successful trend trading. And it’s hard to disagree with this.
Indeed, the profit potential in transactions in the direction of the dominant trend directly depends on the strength of the initial impulse. Any powerful trend, regardless of the time frame, begins with the first impulse movement, pushing prices out of the “smart” money accumulation zone as if from a catapult.
Wyckoff theory
At one time, American investor Richard D. Wyckoff developed a theory based on three “postulates” that later became the basis of his concept of market analysis: the principle of supply and demand, cause and effect, and the relationship between effort and results. We will not go deeper into its study, limiting ourselves to a general description of the Wyckoff cycle.
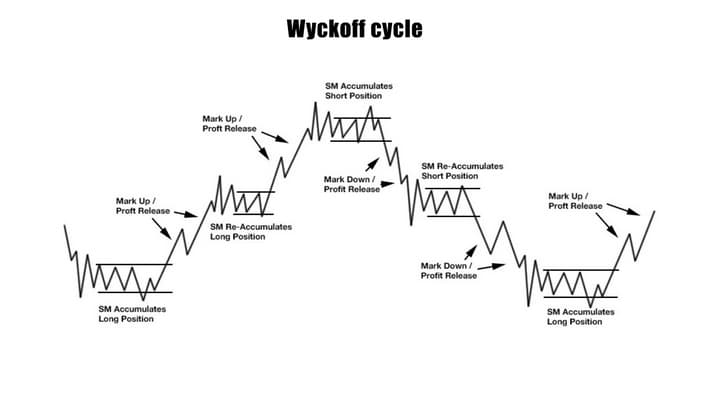
The figure above shows the phases of this cycle. “Smart money” (SM) is the driving force of any financial market, operating in an endless cycle of accumulation and distribution, forming the so-called Wyckoff cycle. Accumulation phases on a chart usually represent price ranges. In turn, the profit distribution phases (“Profit Release”) are characterized by large and rapid movements, literally “shooting” prices out of the accumulation phase.
Taking into account all of the above, the “Ideal Trading System” should signal the opening of a position at the time of the first correction after an impulse breakout of the trading range formed by the accumulation phase.
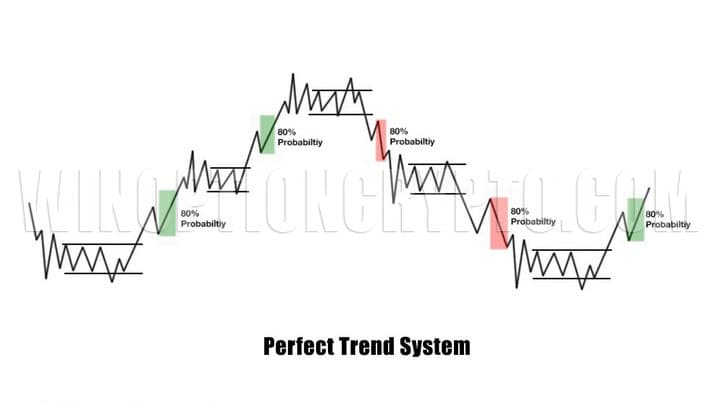
This is exactly what we see in the graph above. The zones of the first correction for purchases are highlighted with a green rectangle, and for sales – with a pink rectangle, clearly demonstrating the effectiveness of this approach. We do not undertake to say that by trading in this way you can get the stated 80% of profitable trades, but it is obvious that this approach has every chance of success.
Thus, the Strong Trends binary options indicator is designed to identify precisely such moments. The trader just has to wait for the desired combination of signals and open a position with a high probability of making a profit. Now it's time to talk about the settings of this tool.
Strong Trends Options
There are few settings: only four blocks, and one of them is very mysterious, but first things first.
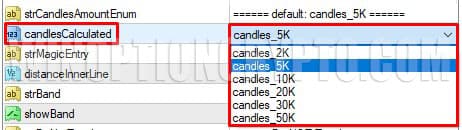
- At the top of the list is “Candles Amount Enum” with the “candlesCalculated” variable, which is responsible for the number of candles for which the orange and blue lines are calculated. The lower the selected value, the lower the load on the computer.
- “Magic Entry” with the “distanceInnerLine” variable, sets the distance between the lines, the rebound from which forms the entry point, expressed in multiples of ATR values

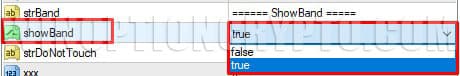
- “ShowBand” is a logical variable that accepts the values True and False. If set to True, a black line will be displayed, which is usually not used. It is useful for backtesting.
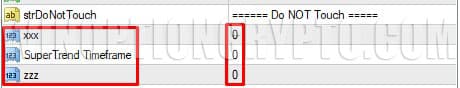
- The last block of settings is the most incomprehensible. “Do Not Touch” literally means “not to touch.” By default, all variables: “xxx”, “SuperTrend Timeframe” and “zzz” have 0 as an argument. The author requests that these parameters not be changed. Why they needed to be moved to external variables remains a mystery.
Trading rules using the indicator for binary options Strong Trends
The Strong Trends indicator for binary options is a universal impulse trading tool that can be used with equal success both in the Forex market and in the cryptocurrency and binary options markets. For its successful application, price jumps are required, which have recently been abundant in financial markets.
The sequence of actions for Call purchases will look like this:
- We are waiting for an upward impulse to appear
- Thick blue and orange lines rise above the price (strong uptrend)
- Below the price there are 2 thin green lines
- The last candle crosses the upper border of the correction channel
- At the opening of a new candle, buy a Call
For Put purchases, the actions are mirrored:
- We are waiting for a downward impulse to appear
- Thick blue and orange lines are falling below the price (strong downtrend)
- There are 2 thin red lines above the price
- The last candle crosses the lower border of the correction channel
- At the opening of a new candle, buy Put
Additional terms
You will have an additional advantage if you open positions only on the FIRST signal and in the direction of the trend of the higher time frame.
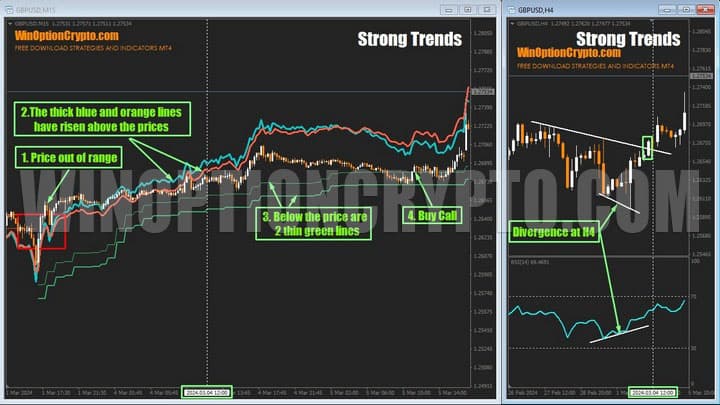
On the slide above you can see an example of multi-timeframe analysis. In chart H4 on the right we see the divergence between the price and RSI (14). Then we wait for confirmation of this signal in the form of a breakout of the bearish trend line (the breakout candle is highlighted with a green rectangle).
On the M15 chart on the left, the moment of breaking through the medium-term trend line is indicated by a vertical dotted line. We see that by this moment our first two conditions had already been fulfilled: prices sharply left the range and both multi-colored moving averages moved above the price. All that remains is to wait for the exchange rate correction to the green stepped channel and the price rebound from it to open a position.
Recommended expiration time is 5 bars depending on the financial instrument. We advise you to select the duration of holding positions based on the results of backtesting.
Please note that the free version of this tool only works on two currency pairs: EUR/USD and GBP/USD. To work with other couples, you must purchase a lifetime license for $89 or rent for a year for $79.
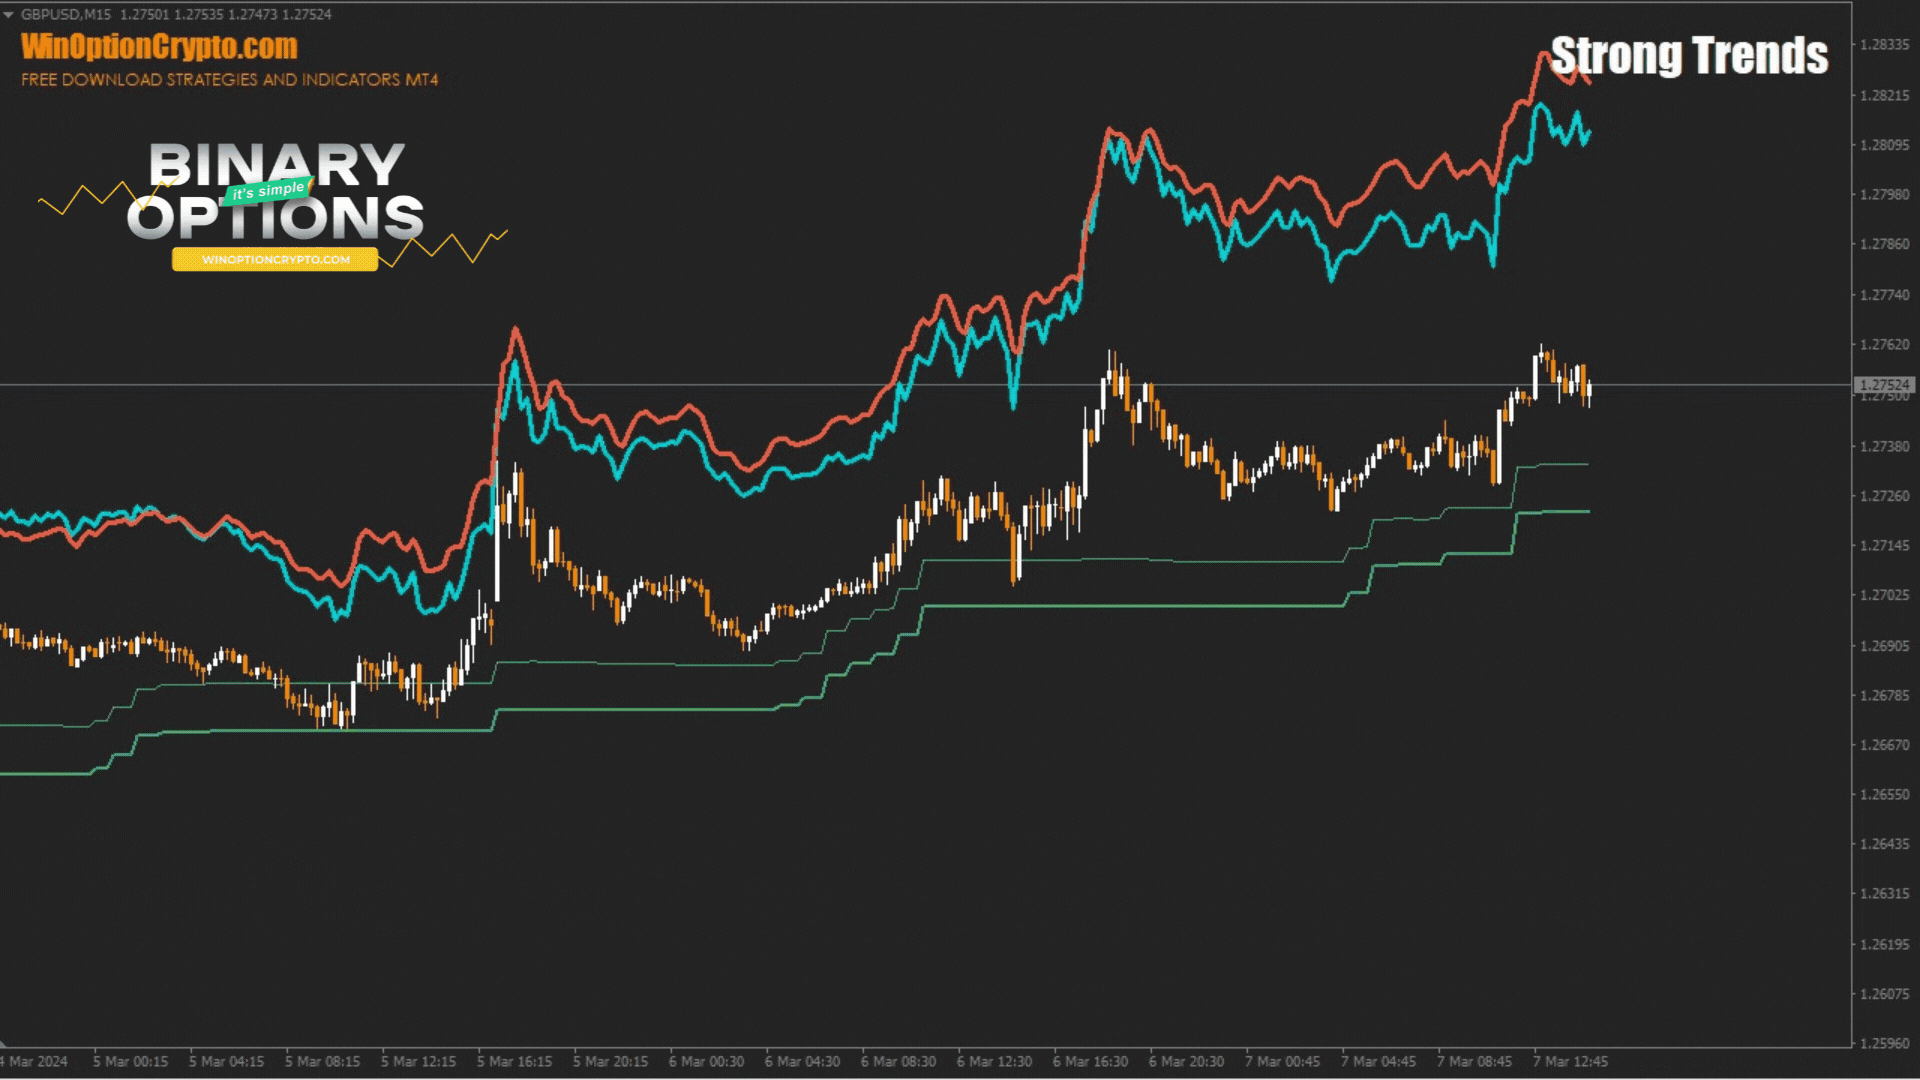
Opening a Call Option
In this example, there was an impulse for growth. Thick blue and orange lines, signaling a strong trend, are located above the candles. At the same time, the green correction channel is below the price. The last bar crosses the upper border of the correction channel from bottom to top. At the opening of a new time interval, we buy a Call.
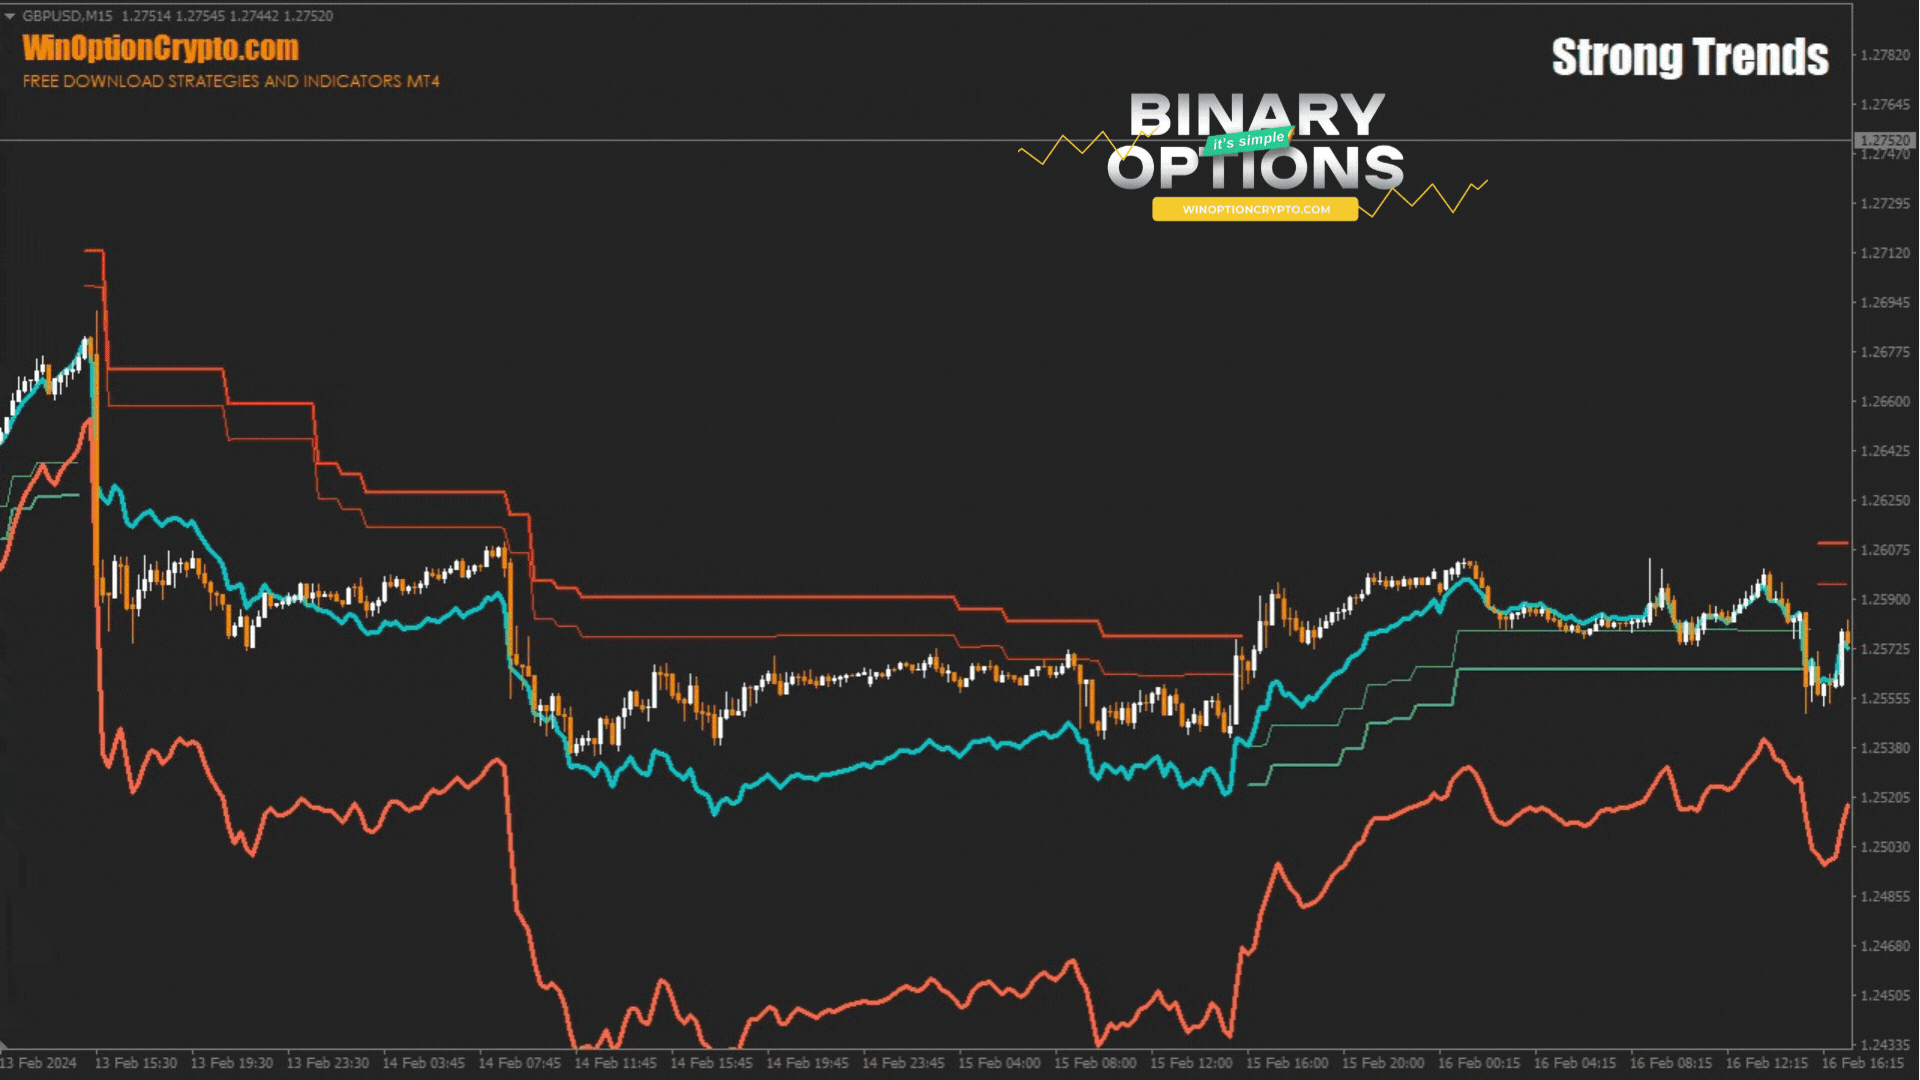
Opening a Put option
In this case, there was an impulse to reduce quotes. Thick blue and orange lines, signaling a strong trend, are located under the candles. At the same time, the red correction channel is above the price. The last bar crosses the lower border of the correction channel from top to bottom. At the opening of a new time interval, we buy Put.
Conclusion
The Strong Trends binary options indicator helps traders systematically find trading opportunities in the direction of strong trends. However, to achieve optimal results, it is important to use this indicator carefully, combining it with other technical analysis tools and risk and capital management strategies, as is the case with any other market analysis methods.
Therefore, it is better to start learning it with a demo account with a proven broker . And only after positive results with virtual money can you proceed to trading binary options on a real account. We wish everyone a favorable trend!
Download binary options indicator Strong Trends

To leave a comment, you must register or log in to your account.