
There are quite a lot of indicators that signal an imminent trend reversal and are suitable for binary options trading. Some of these instruments have already become classic, others appeared relatively recently. Below is a list of the most popular indicators.

Reasons for the popularity of reversal indicators
A binary option buy/sell transaction remains open for a limited time period. In this regard, most traders work with this instrument at moments favorable for trading. That is, trades are closed even if the current trend continues (for example, the price continues to rise or strong momentum continues). Therefore, in order for binary options trading to generate income, you must constantly look for patterns on the chart that indicate an imminent trend reversal. And special indicators have been created for this.
Such tools are distinguished by the fact that they predict the onset of a reversal in advance and provide fairly accurate signals that do not change over time (are not redrawn). Traders using such indicators will learn about an imminent correction a certain time before this event occurs.
The second advantage of reversal technical analysis tools is ease of operation. In fact, to understand the signals from these indicators, it is enough to understand what this or that arrow on the chart shows.
Instructions for installing indicators in MetaTrader 4 :
Relative Strength Index (RSI) – an accurate reversal indicator in binary options
This indicator has been used by traders since the late 70s of the last century in trading various financial instruments, including binary options and currency pairs. The principle of RSI operation is that it compares the general values of quotes for a selected time interval.
The resulting indicators vary between 0-100 and are displayed on the graph as a curved line. In addition, the indicator also graphically marks overbought and oversold levels. The latter are displayed in a separate window in the form of two lines that pass through the 30 and 70 marks, respectively.
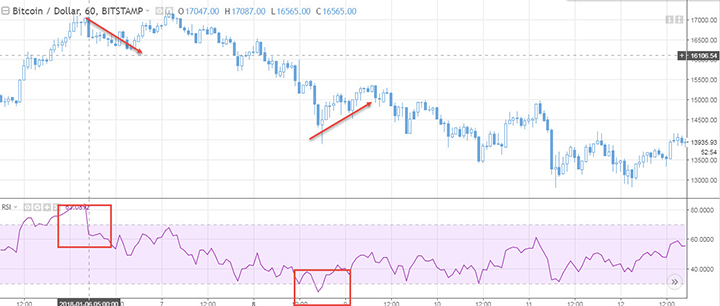
The above screenshot shows how the indicator works when trading the BTC/USD (bitcoin to dollar) currency pair. We recommend responding to signals that arise when the price chart goes beyond the overbought or oversold levels. Such situations often end in a correction of the current trend or a trend reversal.
The essence of such signals boils down to the following: the RSI line is located above 70, which indicates that the asset is overbought. As soon as the indicator drops below this level (pierces it from top to bottom), it is necessary to open a trade to sell the option.
If the RSI line is below 30, then this situation indicates that the asset is oversold. As soon as the indicator breaks this level, you need to place an order to buy the option.
We strongly do not recommend opening transactions during a period when the RSI is above or below the overbought and oversold lines, respectively. This may result in losses.
The RSI indicator also provides other signals that can be used in stock trading. But in our opinion, opening transactions after breaking through overbought and oversold levels often brings profit.
Download the RSI indicator
Momentum
Momentum is an excellent impulse reversal indicator for binary options; it has simple settings and we recommend not making changes to them and working with the indicator in the time period specified on the platform.
Traders use several formulas with which to configure this instrument. More often, the difference between the closing prices shown in the current and previous time periods is established.
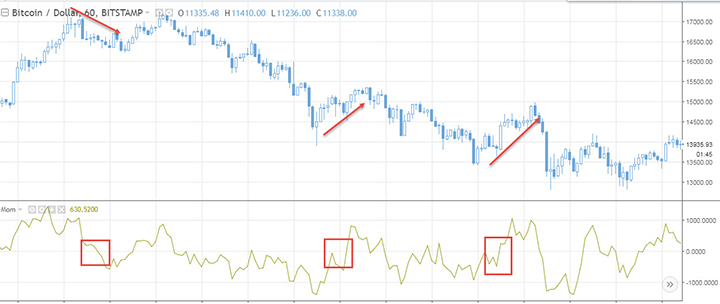
Traders mainly work with two types of signals that this indicator gives. The first occurs at the moment when the Momentum indicator line reaches significant levels and begins to reverse. However, it is precisely this nuance that causes a lot of controversy. Traders have not yet decided which values should be considered significant. Some work based on overbought and oversold levels (can be set in the indicator settings). But this approach is not always effective.
The above screenshot shows the second type of signal: the indicator line crossing the zero mark. In this case, we are talking about confirming the current trend.
Download the Momentum indicator
Q2MA
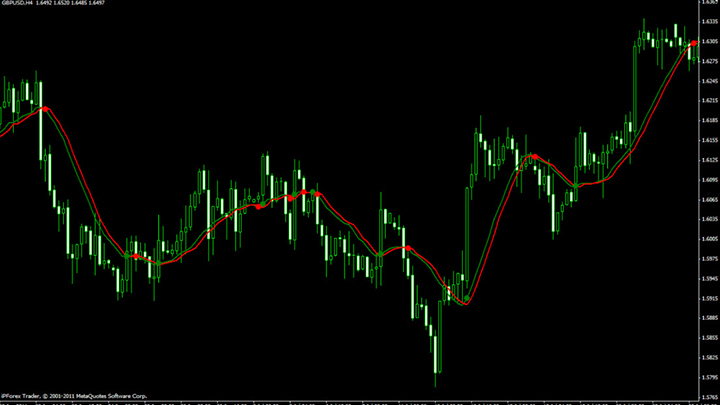
This indicator is one of the relatively new developments of reversal indicators. Q2MA is based on an algorithm by which moving averages are calculated. The latter are used in many trading strategies. Essentially, this indicator represents two moving averages. As soon as these lines intersect with each other, you need to place an order.
The main disadvantage of the Q2MA reversal indicator is that it is often redrawn. On the other hand, the indicator is simple and available on most platforms. But due to the high probability of redrawing, we do not recommend using Q2MA in binary options trading.
Download the Q2MA indicator
Forex Glaz
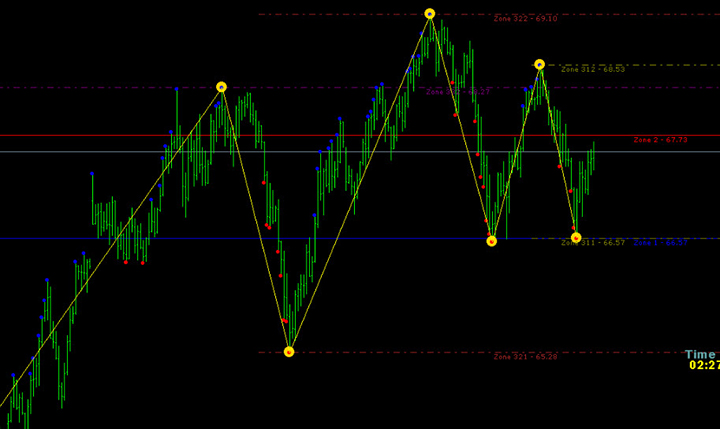
The essence of the indicator’s operation is simple and boils down to the fact that the appearance of points (extrema, or maximum prices) on the chart indicates an imminent trend reversal. In addition, Forex Glaz shows through lines which direction the price chart will go. Therefore, this indicator seems especially attractive, especially for novice traders.
But it is precisely in the simplicity of Forex Glaz that the danger lies. Like Q2MA, this indicator is often redrawn. That is, the yellow dots on the chart may suddenly disappear after placing a buy or sell order. The developers of this tool do not recommend working with it on timeframes less than 15 minutes. However, as practice shows, the indicator behaves similarly in other time intervals.
Download Forex Glaz indicator
Visual MACD
Compared to the traditional MACD, this indicator differs in that it displays the chart in a separate window. Also, this version of the popular instrument has an additional signal line. The principle of working with Visual MACD comes down to observing the following rules:
- You can open a buy deal if two lines intersect from bottom to top and the histogram turns blue.
- You can place a sell order when the signal lines cross from top to bottom and the histogram turns red.
Download Visual MACD indicator
The above signals are not always accurate and the trend may continue.
Recommended indicators
To determine the moments of trend reversal, we recommend using the Stochastic , Momentum and RSI indicators. In this case, only one tool can be used. In such cases, the optimal one would be RSI, which has good performance when trading binary options.
This is explained by two factors:
- no redrawing:
- signals always appear ahead of time.
Most modern indicators can only be purchased for money. And this is partly where their shortcoming lies. The developers of such indicators hide the formula on the basis of which they make calculations. And this does not allow the trader to independently determine in which cases the chosen instrument will be useful and in which it will not.
Moreover, indicators with a closed formula cannot be verified. And it is impossible to analyze the effectiveness of the tool.
The second main disadvantage of such indicators is that they are distributed for money. All technical tools do not provide accurate signals all the time. Moreover, not every indicator is suitable for a particular trading strategy. Therefore, it makes no sense to pay money for something that does not bring results.
Can't figure out how this strategy or indicator works? Write about it in the comments to this article, and also subscribe to our YouTube channel WinOptionCrypto , where we will definitely answer all your questions in the video.

To leave a comment, you must register or log in to your account.