
According to traders working with binary options, one of the most profitable moments is considered to be entering the market against the current trend (the so-called momentum attack). If you open a trade at a time when prices are just beginning to move strongly, you can make a significant profit. However, finding this entry point is quite difficult due to the fact that each such impulse arises rapidly and quickly fades away. Specific impulse indicators for binary options help solve this problem.
What are impulses in stock trading?
In stock trading, impulse refers to a sharp change in the price of an asset. In this regard, it is recommended to work in such a market only with short-term options on the 5-minute chart. It makes no sense to open trades for a longer time interval, since during such a period the impulses have time to fade away. It is optimal if work is carried out in time frames within 1-15 minutes.
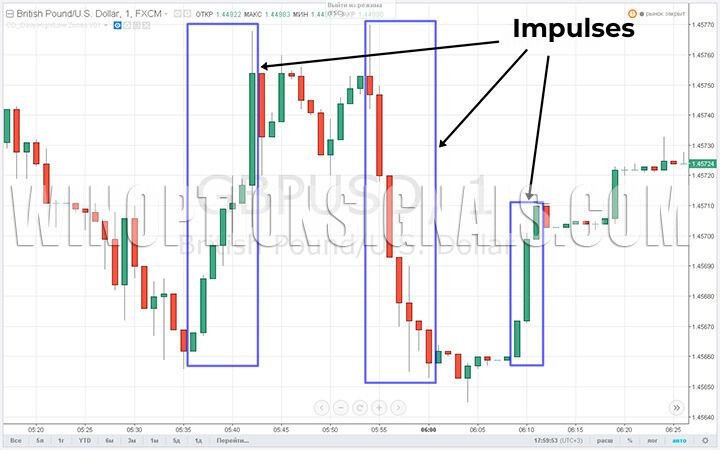
The appearance of impulses is due to the fact that at a certain point in time a trader entered the market and bought or sold a large block of an asset at a time. Therefore, in order to make money on such situations, it is necessary to find a way to predict the emergence of large players in the future.
When do the impulses appear?
There are three reasons for the appearance of impulses in the market:
- Fundamental. This group includes news and other important information (various force majeure events, such as natural disasters) that have a significant impact on a certain currency.
- Technical. This group includes situations where many traders have opened large volume orders with prices located close to important levels. In addition, technical reasons include cases of rapid closure of large options or futures contracts (monthly, weekly and others).
- Psychological. Characteristic of situations when asset prices fluctuate around important (psychological) levels over a fairly long period of time. In such a market, tension among traders is constantly growing.
The reasons for the first nature are difficult to predict. Therefore, it is recommended to work with technical and psychological factors, which can be seen on the current charts.
Momentum indicator
The Momentum indicator is able to determine the moment of impulse occurrence on the price chart. This tool is highly effective in such situations.
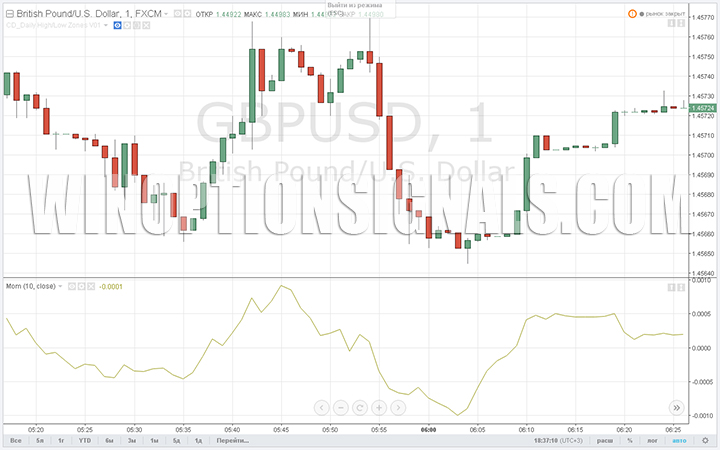
The principle of operation of the indicator is quite simple and boils down to the following: Momentum determines the entry point by subtracting the closing prices of several (N) bars from the last closing price.
The main advantage of the tool is that it predicts in advance the time of occurrence of the impulse. The lines formed by the indicator show in which direction the price will make a breakthrough. If they do not change direction, then this indicates a continuation of the trend.
One of the main patterns, the appearance of which indicates the imminent emergence of an impulse, is rails. This figure indicates a price reversal. This pattern gives fairly accurate results.
The indicator builds a pattern using two bars of approximately the same size, but with different directions. Momentum cannot be customized. The only parameter that the user can set is the number of bars (substituted instead of N using the specified formula). By increasing this value, you can “weed out” weakly expressed impulses and leave only strong ones. If this parameter decreases, the indicator becomes more sensitive to weak price fluctuations.
Momentum is suitable for trading on 30-minute charts. Working on smaller time frames with this indicator is difficult.
Despite the fact that Momentum is highly effective, the signals from this tool are not enough to determine the exact entry into the market. Therefore, it is recommended to additionally use other indicators to search for impulses.
Download the Momentum indicator
Levels, flats and price patterns
As mentioned earlier, impulses occur near important levels (in particular, support and resistance). When the price approaches these indicators, you need to prepare to enter the market.
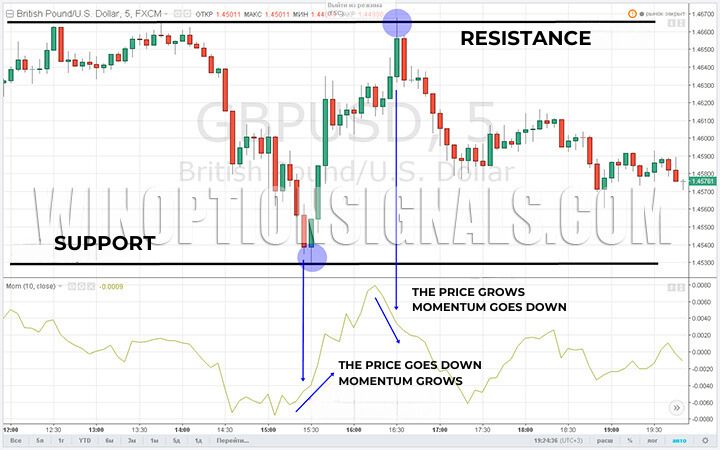
As an example of how the indicator works, we can consider the following situation: the price of an asset moves up towards the resistance level, but the Momentum line is directed downwards. With this combination, you should wait for a correction.
However, if the price has not broken through an important level, but the last bar closes in the opposite direction and the indicator line has accelerated, you need to open a buy or sell trade (depending on the direction of the bar). This moment shows the imminent emergence of an impulse.
The second good moment to open a transaction is a breakout of the price level during a period when the trend is moving sideways (flat).
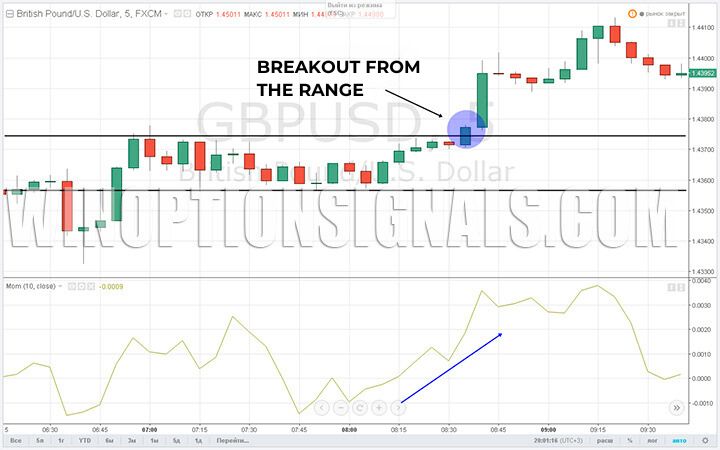
The appearance of an impulse should be expected at the moment when a long sideways range is formed on the chart. The market entry point is located where prices go beyond this corridor. As soon as there is a breakdown of the upper or lower line, it is necessary to enter into a deal provided that the indicator moves in the same direction.
The final way to use Momentum involves combining price patterns and chart patterns. This option gives accurate signals shortly before the impulse appears.
Graphic patterns such as a pennant or a triangle (the first is shown as an example in the screenshot) can also indicate the approach of a powerful price jump. However, this tool is only effective in the long term. Momentum can smooth out this nuance when working on minute charts.
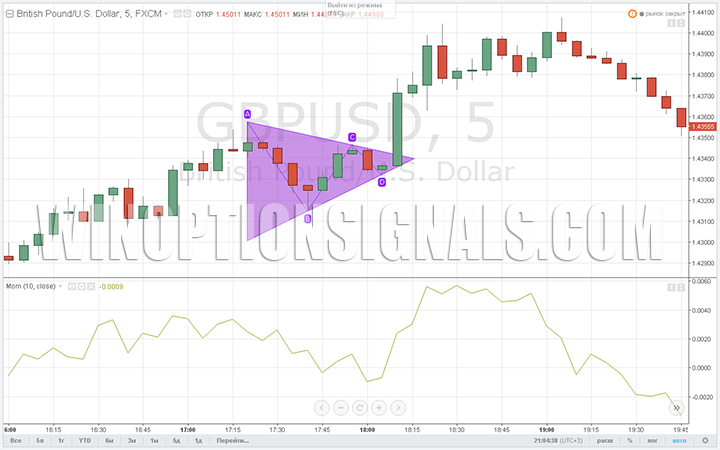
As shown in the screenshot, the indicator line on the last bar begins to rise sharply. This means that the price will soon break through the upper edge of the pennant. On the next bar this signal is confirmed.
Based on the above, it turns out that in a situation where the triangle narrows to a minimum, but the Momentum line begins to grow (fall), you should enter the market.
Bollinger Bands indicator
This indicator can also be used to predict impulses. The smaller the distance between the Bollinger Bands, the more likely it is that the price will break out of the current range.
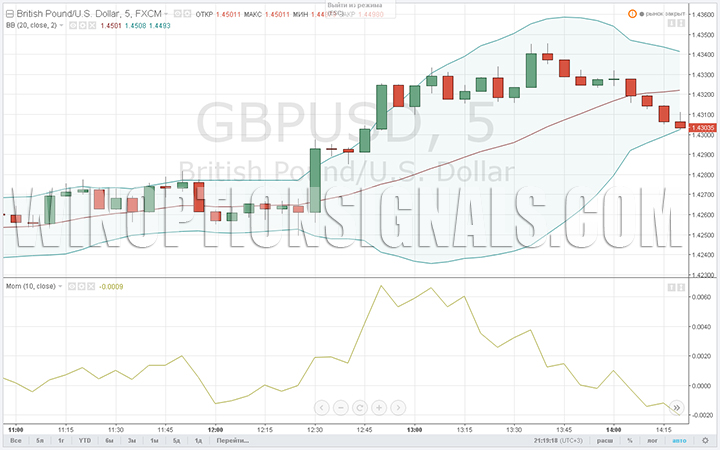
The above chart shows a prolonged narrowing of the Bollinger Bands. Shortly before the price broke through the upper line, the Momentum indicator showed a sharp jump. As soon as the upper Bollinger band is passed, you need to open a deal to buy the asset.
Download the Bollinger Bands indicator
Finally
The Momentum indicator in combination with other technical analysis tools can bring relatively large income when trading binary options. At first, this strategy may cause some difficulties. In particular, difficulties usually arise when determining the moment of occurrence of an impulse. But over time, these problems will disappear. However, it is recommended to carry out the first transactions using a minimum deposit.
Can't figure out how this strategy or indicator works? Write about it in the comments to this article, and also subscribe to our YouTube channel WinOptionCrypto , where we will definitely answer all your questions in the video.

See also:
Accurate arrow indicators for binary options
Best indicators for binary options in MT4
To leave a comment, you must register or log in to your account.