
The RED Wave Oscillator indicator for binary options is an oscillator indicator that is designed to determine divergences between the third and fifth Elliott waves , which is not always easy to see on your own, but thanks to the RED Wave Oscillator you will be able to see absolutely all divergences.
It is worth noting that although the indicator has all kinds of alerts and signals, it may seem complicated to beginners, since there is a need to understand what divergences are.
Also, the RED Wave Oscillator 2.0 indicator is paid, but you can download it for free from our website for review.
Characteristics of the indicator for binary options RED Wave Oscillator
- Terminal: MetaTrader 4 .
- Time frame: M1-D1.
- Expiration: 2 candles for the aggressive method and 5 candles for the conservative method.
- Types of options: Call/Put.
- Indicators: RED Wave Oscillator v2.56.ex4, FT Elliott Trigger 1.16.ex4.
- Trading instruments: any.
- Trading hours: 8:00-18:00.
- Recommended brokers: Quotex , PocketOption , Alpari, Binarium .
Installing the RED Wave Oscillator 2.0 binary options indicator in MT4
Indicators are installed as standard in the MetaTrader 4 terminal.
MetaTrader 4 instructions for installing indicators:
Description of the indicator for binary options RED Wave Oscillator
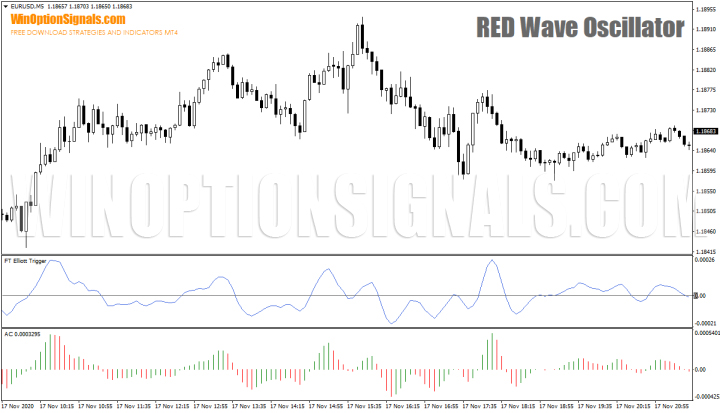
The RED Wave Oscillator indicator can be used separately, but it also comes with another indicator called FT Elliott Trigger. By combining these indicators, it will be possible to receive even more accurate signals on divergences, so we will consider each of them in turn.
RED Wave Oscillator 2.0 indicator
The RED Wave Oscillator indicator for binary options is an advanced version of the Awesome Oscillator indicator:
And these indicators are based on Moving Averages . The difference between the RED Wave Oscillator and AO is the very broad and new functionality of the indicator, which includes signals and alerts, as well as many other variables that allow you to track divergences.
Main functionality of RED Wave Oscillator 2.0:
- Determination of extreme points (extrema are redrawn and work according to the principle of the Zig Zag indicator);
- Determination of divergences between the price and the oscillator (marked on the chart with a signal and an alert);
- Flexibly customizable alerts (allows you to reduce the number of false signals);
- Setting up a multi-timeframe panel, which includes three different binary options timeframes (manually configured);
- Visual adjustment of all indicators.
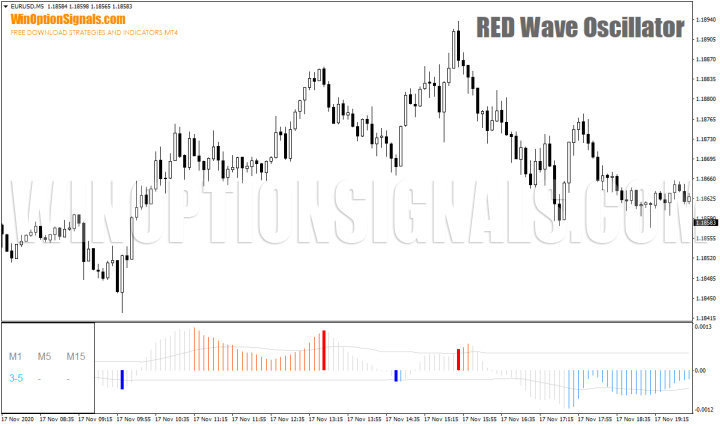
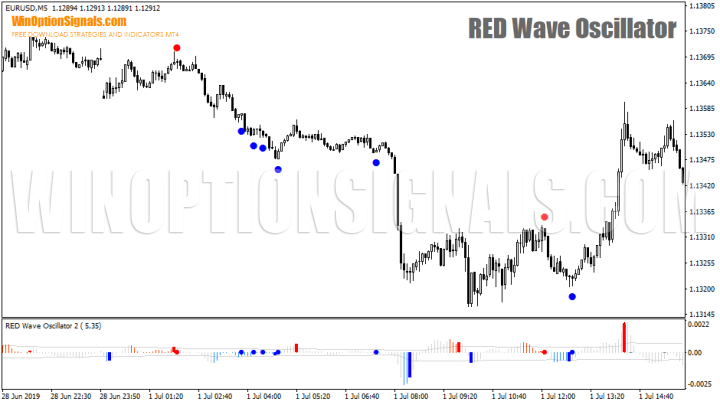
As a result, the RED Wave Oscillator itself looks like this:
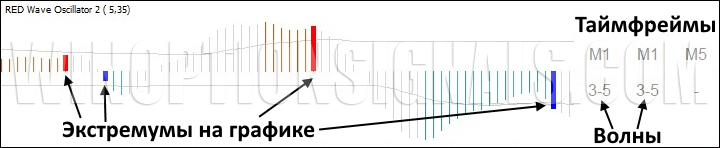
Thick bars on the indicator mark extreme points on the chart (not to be confused with extreme points on the indicator itself). Also on the right or left there can be a panel with time frames and wave types, which are specified in the settings.
There are a lot of settings in the RED Wave Oscillator 2.0 indicator, and some of the main ones are the settings for displaying the oscillator itself and the type of construction:
|
|
|
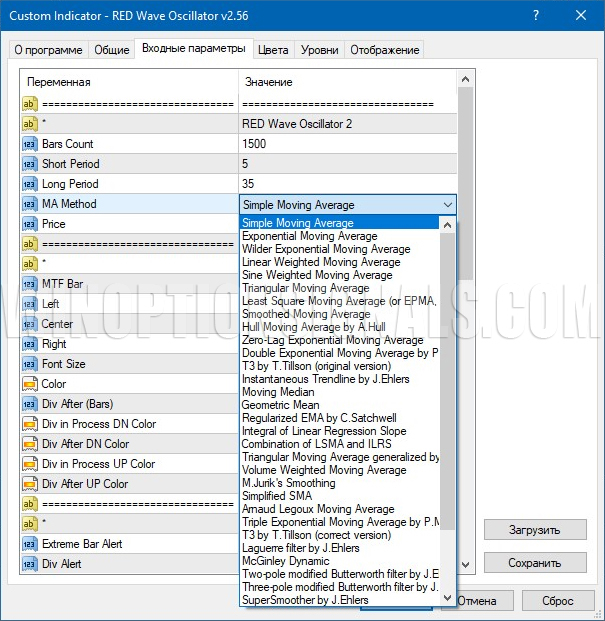
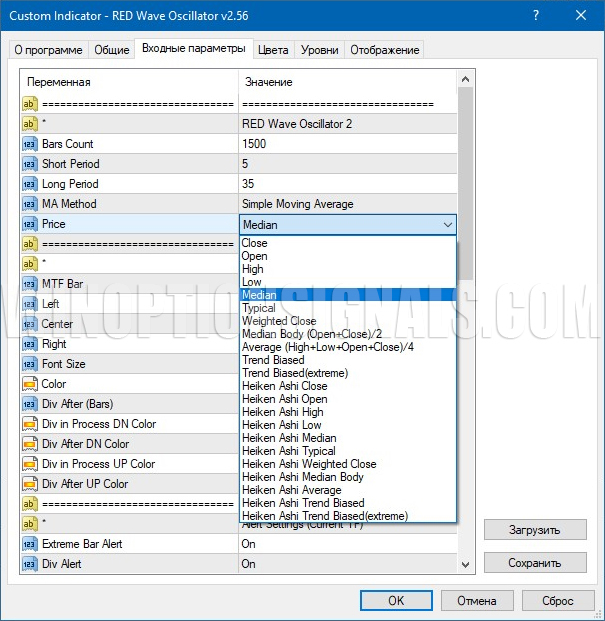
As you can see from the images above, you can choose both the MA construction method for the RED Wave Oscillator indicator and the type of price that will be used for construction.
Note: you should not use very exotic MA methods and price types at the initial stage, as this may lead to the appearance of signals that will not be clear and may turn out to be false.
To understand why so many different settings are needed, you can compare indicators based on SMA (Simple Moving Average) and HMA (Hull Moving Average) :
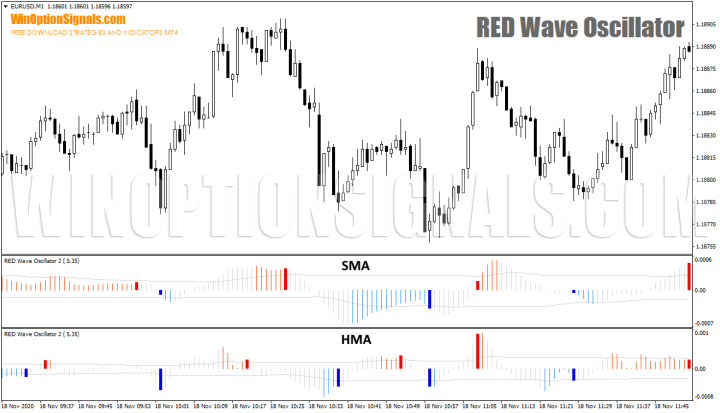
From the example above you can see that the construction turns out to be completely different, since different “moving average” algorithms are used.
To customize the Moving Average periods, you will need to edit the "Short Period" and "Long Period" variables, which default to "5" and "35".
The second most important are the settings of the timeframe panel, in which you can specify three different timeframes:
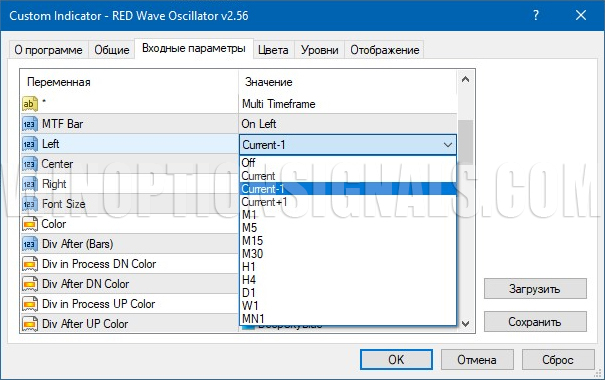
You can configure each of the three periods and the display can be done both with the previous timeframes from the current one by specifying the value “Current-1”, and with the next highest timeframes by selecting “Current+1”, or you can specify any other timeframe manually.
These settings allow you to observe divergences on three timeframes at once, without switching between them:
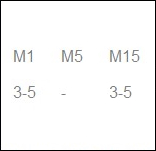
And if there are values “3-5”, then there is divergence.
To choose the type of divergence (“3-5” or any other), it is worth considering the third most important settings:
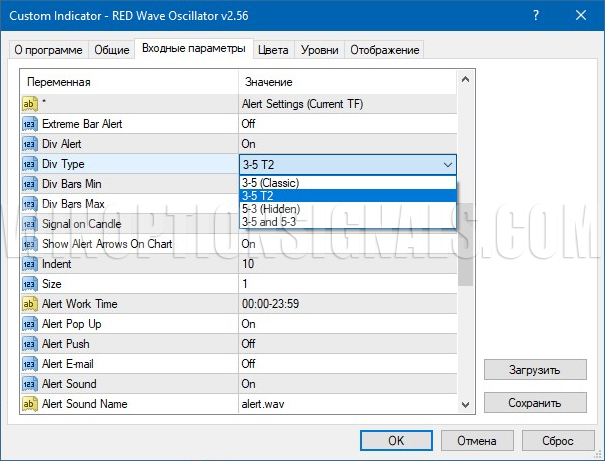
Divergence type settings (“Div Type”) allow you to choose from four types:
- “3-5 (Classic)” – classic divergence;
- “3-5 T2” – classic divergence of the second type (when the RED Wave Oscillator 2.0 indicator went beyond “0”)
- “5-3 (Hidden)” – hidden divergence;
- “3-5 and 5-3” is a classic and hidden divergence.
It is best to use standard waves “3-5 T2” for divergences, since such settings are recommended by the author of the indicator and many other traders who trade using Elliott wave divergences.
In addition, you can use advanced settings for divergences and set the number of bars that should be used when signals appear (variables “Div Bars Min” and “Div Bars Max”).
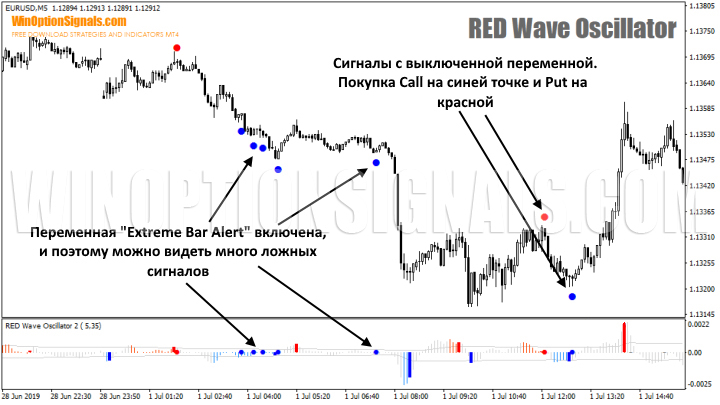
Please note that it is better not to include the “Extreme Bar Alert” variable, since if it is turned on, a lot of false signals will appear on the chart.
There, in the settings, you can enable or disable the appearance of signals on the chart (“Show Alert Arrows On Chart”), the operating time of the signals (“Alert Work Time”), as well as the alerts themselves by changing the “Alert Pop Up” variable. If alerts are enabled, the following notification will be sent:
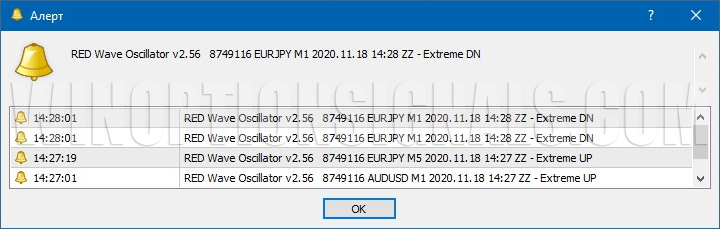
Signals on the chart can be seen either in real time or after running the indicator in the tester:
Signals are not displayed on history.
Please note that the signals are red and blue dots, and the thick bars are only divergences on the standard oscillator without taking into account Elliott waves.
All remaining settings are responsible for the visual component.
FT Elliott Trigger Indicator
There is no point in saying too much about the FT Elliott Trigger indicator for binary options, since it has absolutely the same settings except for signals that are not marked on the chart, but alerts can still be configured.
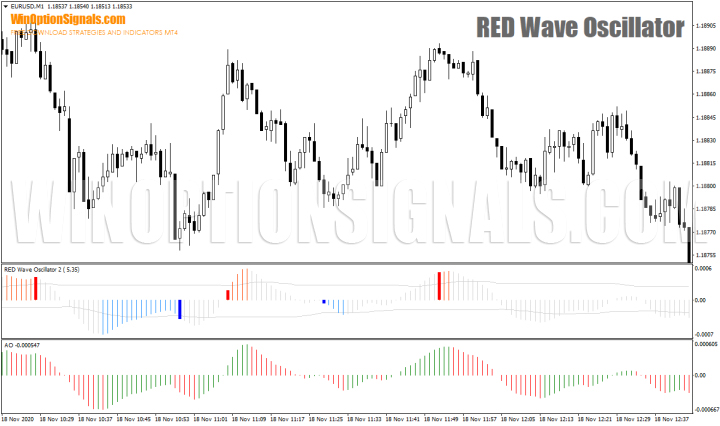
This indicator is based on the second similar indicator Accelerator Oscillator, but like the RED Wave Oscillator, it has more advanced settings:
A little about divergences using the RED Wave Oscillator 2.0 indicator
Speaking of divergences, they can be classic and hidden:
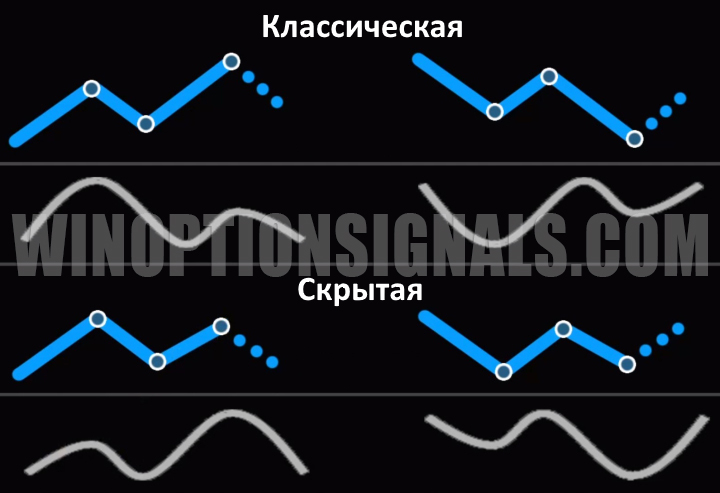
Classic divergences are more pronounced, while hidden ones, on the contrary, can be built without updating peaks (on the indicator or price).
There is no point in going into details about divergences, since all of them are marked on the chart with signals and alerts, and therefore you will not have to track them yourself.
Those who want to learn more about how to use divergences on any other indicators should read the article on the MACD divergence indicator .
Speaking about Elliott waves, this topic is very extensive and difficult to quickly explain, but to make it easier to understand which waves are used by the indicator to search for divergences, you can consider an example of five waves according to Elliott theory:
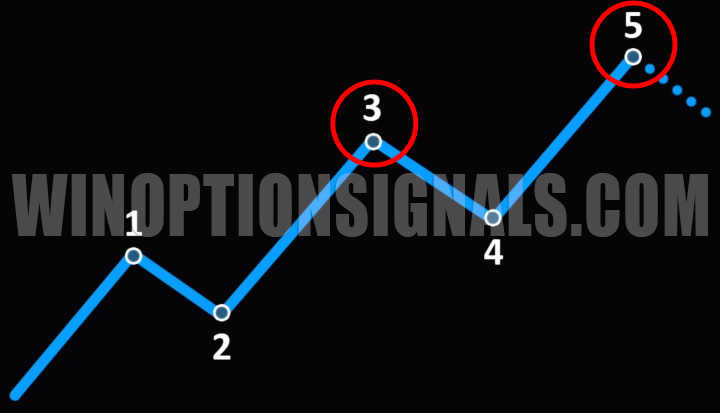
The example shows that the waves are formed sequentially, and divergences, which are accompanied by red and blue dots on the chart, occur along the 3rd and 5th waves.
It is also worth noting that although trading with a trend is correct, when using divergences, strong trends are harmful, since they do not allow signals to form for a long time. Therefore, it is better to avoid trend areas with strong unidirectional movement when trading using the RED Wave Oscillator indicator for binary options. Flats (sideways trends), on the contrary, allow you to receive accurate signals, so the wider the price range, the better.
Rules and examples of trading using the indicator for binary options RED Wave Oscillator 2.0
There are two ways to buy options using the RED Wave Oscillator indicator, and one of them is aggressive, and the second is conservative. The settings are used by default (as in the template).
Aggressive method
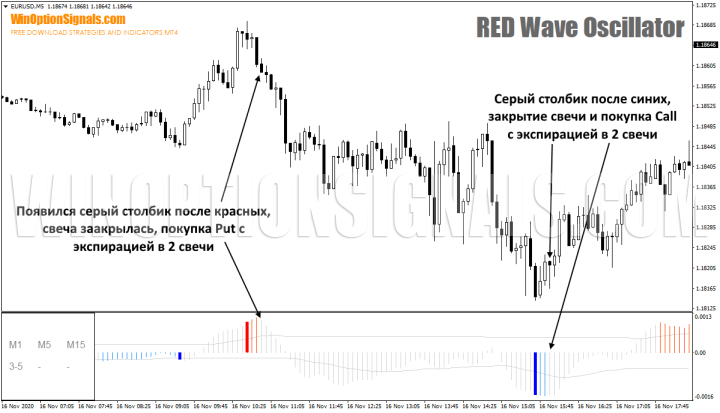
An aggressive approach involves using simple divergences, which are highlighted by thick red and blue bars on the oscillator. This approach is highly risky because these bars, as mentioned earlier, are redrawn due to the formation of new extremes by the price, although initially it may be that divergence has already appeared. Therefore, this approach involves using the expiration time of binary options in 2 candles.
Call options are bought when a gray bar appears after the blue bars on the oscillator, and the candle must close. Put options are bought after the candle closes on the gray bar that appears after the red bars:
You can also increase the effectiveness of this approach using the previously discussed FT Elliott Trigger indicator, which can show divergences in the same areas:
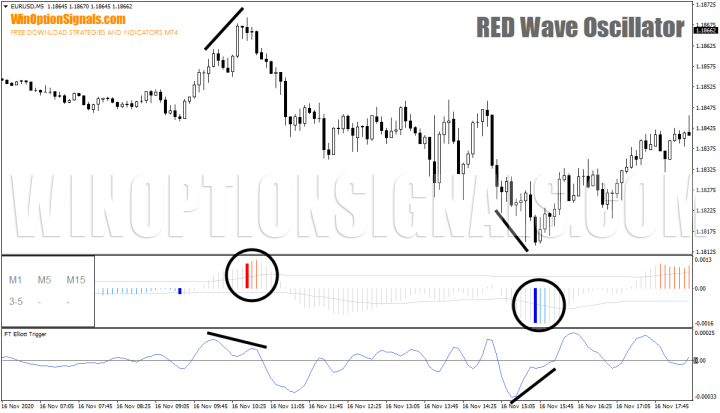
As you can see, divergences were formed on the same signals using the FT Elliott Trigger indicator, which confirms the signals received previously.
Conservative method
The conservative method involves trading based on the signals of the RED Wave Oscillator indicator, which appear on the chart. The advantage of this method is that these signals are not redrawn, but the main thing that needs to be done is to disable the “Extreme Bar Alert” variable.
Call options are bought after blue dots appear with an expiration of 5 candles, and Put options are bought when red dots appear with the same expiration:
Conclusion
The RED Wave Oscillator indicator for binary options, as you can see, allows you to receive various signals for trading options based on divergences based on Elliott waves and standard oscillators. The advantage of the indicator is that all signals can be seen on the chart, and the most accurate of them are accompanied by alerts. And the set also includes a second indicator, which allows you to increase the efficiency of using divergences.
Regardless of how profitable this indicator can be, when trading using it, you should always follow the rules of money management and risk management , and make transactions only through a quality broker, which you can choose in our rating of binary options brokers .
Download the RED Wave Oscillator indicator for free
Can't figure out how this strategy or indicator works? Write about it in the comments to this article, and also subscribe to our YouTube channel WinOptionSignals , where we will definitely answer all your questions in the video.

See also:
Psychology in trading - what does a beginner need to know?
Technical analysis in binary options trading
To leave a comment, you must register or log in to your account.