
The indicator for binary options support and resistance represents the price levels at which the price is most likely to stop or reverse. Thanks to this, you can not only predict reversals in any market, but also build your own trading strategy for binary options or use an existing trading strategy based on support and resistance levels .
Also, this indicator of support and resistance levels can be added to an existing system or added as a filter for any indicator.
Characteristics of the support and resistance indicator
- Terminal: MetaTrader 4 .
- Time frame: Any.
- Expiration : 5 candles.
- Types of options: Call/Put.
- Indicators: indicator of support and resistance levels.
- Trading instruments: all currency pairs.
- Trading hours: 9:00-17:00.
- Recommended brokers: Quotex , PocketOption , Alpari, Binarium .
Installing Support and Resistance Indicator in MT4
The indicator is installed as standard in the MetaTrader 4 terminal.
MetaTrader 4 instructions for installing indicators:
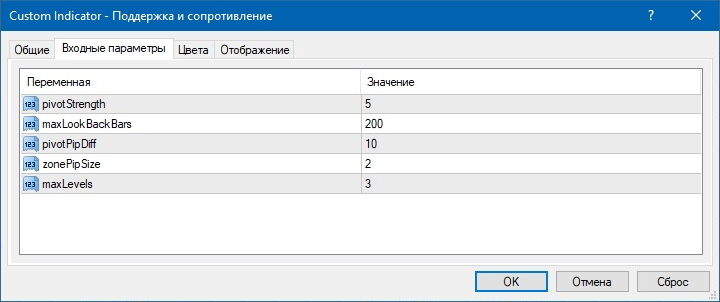
The indicator of support and resistance levels has various settings that can be changed if desired. For example, you can set a larger number of levels thanks to the “maxLevels” parameter and increase or decrease the strength of the levels by changing the value of the “pivotStrength” parameter:
Also, if the indicator of support and resistance lines is set manually, then you should change the black color to transparent on the “Colors” tab:
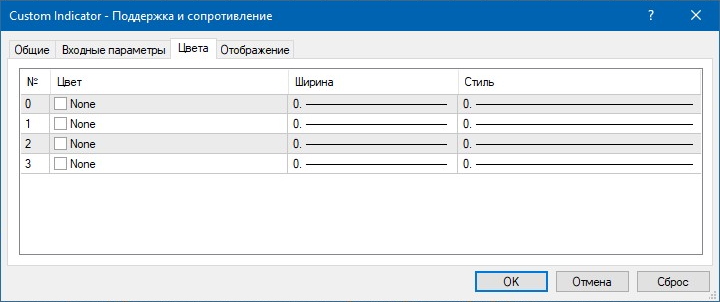
If you do not change colors, then there will be vertical lines under the candles:
Trading rules and description of the support and resistance indicator
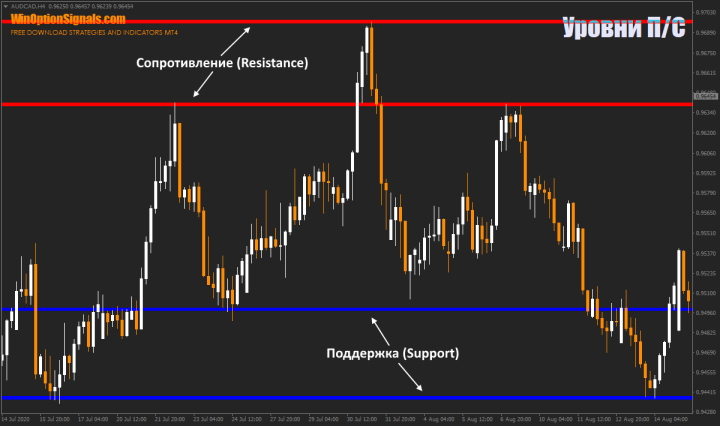
The concepts of “support” and “resistance” provide a logical vision of the trend, graphic figures and patterns. A correct forecast thanks to the levels will help you understand what you can expect in the future - continuation of movement further in the same direction or changing it to the opposite.
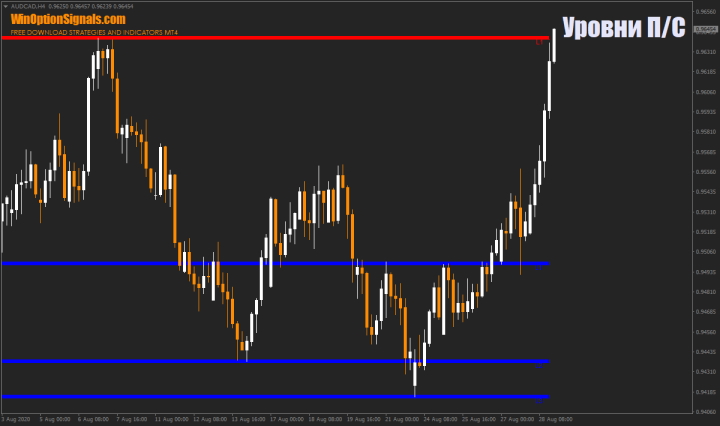
“Support” is a price level at which there is a high probability of stopping and reversing the downward trend. On the chart, it looks like a horizontal line that the market can cross, but after that, almost immediately the price returns back or is at this level. Having pushed off from this line, the trend, theoretically, should turn around and begin to move in the opposite direction.
“Resistance” is a price level at which there is a high probability of stopping and reversing the uptrend. This level also looks like a horizontal line, which most often the price cannot overcome and after the price pushes away from this level, a reversal may occur:
The big advantage of levels in binary options trading is that they can be used on absolutely any time frame or market, since prices move the same everywhere and differences can only be in the amplitude of movement or volatility. Also, quite often certain levels can be relevant for a long time, which makes it possible to make transactions every time the price approaches them, and if such a level is broken, then in 90% of cases it will become “mirror”, which will also allow it to be used in profitable trading .
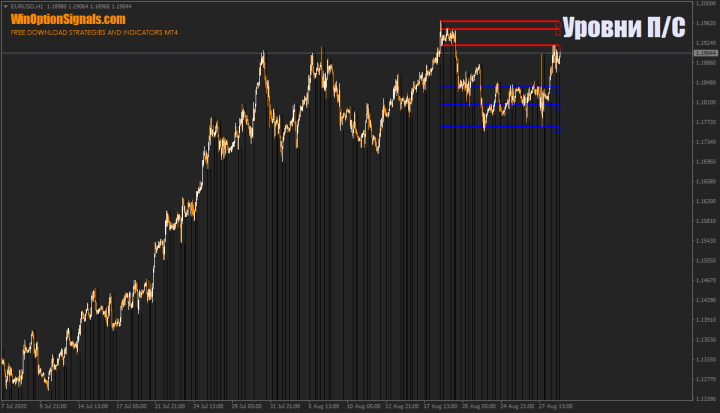
It is also not necessary to use only price levels, as this approach is more suitable for beginners. Experienced traders most often use zones that consist of just such support and resistance levels. The essence of this approach is not to trade breakouts of levels, but to take movements within the range when the price approaches the zone. If we take the image used above, it will look like this:
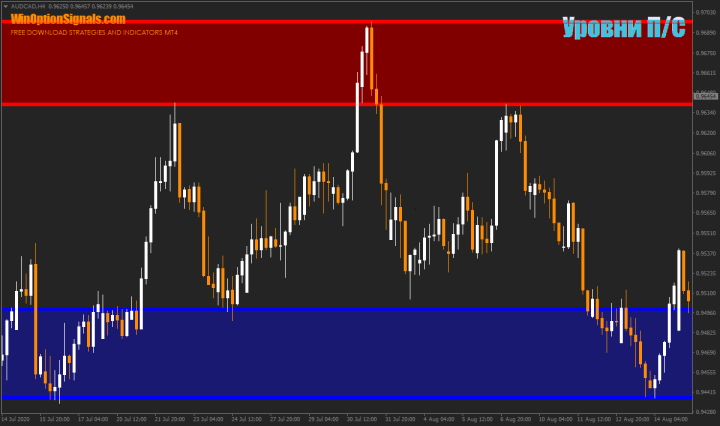
Accordingly, when the price approaches the upper resistance zone (red), you need to buy Put options, and when the price approaches the lower support zone (blue), you need to buy Call options. It is worth noting that with this approach, trading is not carried out in touch, but after the price has already left the zone (it will confirm that the zone is urgent). This approach may seem complicated at first, but in fact it is better and more accurate, and all new traders should consider it in the future.
Also, in addition to this indicator, there are quite a few other indicators of support and resistance for MT4 , which are similar to each other, but most often are built using different algorithms. It could be:
- Zones of supply and demand.
- Fibonacci levels.
- Levels of local extremes.
- Murray levels.
- Pivot levels.
You can use any of these support and resistance lines in binary options trading, since they differ only in the method of calculation, but most often they will show general price levels.
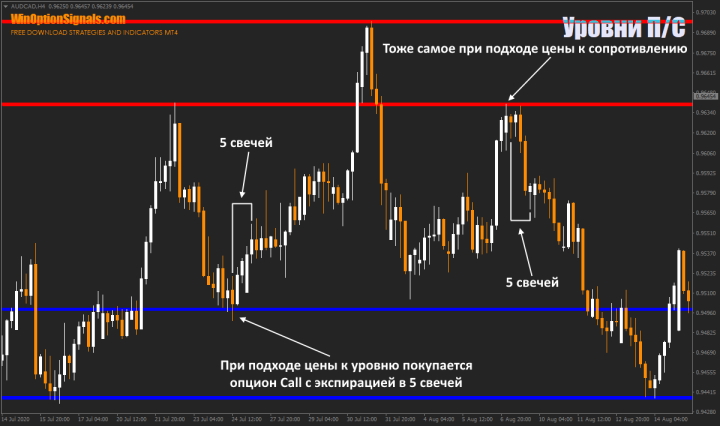
If we talk about the rules of trading using the indicator of support and resistance lines, then, as has already become clear, the Call option is bought when the price reaches the support level, and the Put option is bought when the price reaches the resistance level. Expiration should be equal to 5 candles from the current time frame.
Also, signals based on the indicator of support and resistance lines can be improved if you are able to correctly determine the trend and trade along it, but in this case there may be fewer signals, since trading will only be carried out according to the current trend on pullbacks.
Examples of trades using the support and resistance indicator
To make it as clear as possible when options are purchased when trading with an indicator of support and resistance levels, let’s look at examples on the chart of the AUD/CAD currency pair and the H4 time frame.
Call and Put options
In this range, it was possible to buy options at different levels, since a large time frame and a wide range were used:
Conclusion
The Binary Options Support and Resistance Line Indicator is easy to understand and use, making it suitable for both new and experienced traders. The advantage of this indicator is that it can be used on any time frames and markets, which means it is suitable for any type of trading.
Despite the simplicity of the rules for trading using the indicator of support and resistance levels, it is always worth adhering to the rules of money management and risk management , as they allow you not to lose your entire deposit during unsuccessful transactions. It is also very important to test the indicator on a demo account to verify it and understand how it works.
And do not forget that for trading it is important to choose a quality broker, which you can find in our rating of binary options brokers .
Download support and resistance indicator
Can't figure out how this strategy or indicator works? Write about it in the comments to this article, and also subscribe to our YouTube channel WinOptionCrypto , where we will definitely answer all your questions in the video.
See also:
Pros and cons of trading binary options
Psychology in trading - what does a beginner need to know?
To leave a comment, you must register or log in to your account.