
You can make a profit when trading binary options only if certain conditions are met. The most significant of them are a high-quality trading system and competent money management. Finding a truly profitable strategy is quite difficult. This is due to the constant change in the market. Strategies that generate income today may not be effective tomorrow. Also, do not forget about the individual characteristics of each individual trader.
Today on the Internet you can find many strategies designed to make money on binary options. The most popular are those based on technical indicators or patterns of price behavior. To reduce risks and make a profit, regardless of the market situation, it is recommended to use several strategies at once during the trading process. Below we will present one such strategy, called the “DTL Strategy”. It is based on trend lines and corrections.
Characteristics of a DTL Strategy
- Platform: doesn't matter.
- Trading instruments: any currency pairs.
- Timeframe: from M1 to H1.
- Expiration: 1-5 candles (adjusted in relation to the selected timeframe).
- Time for trading: around the clock.
- Recommended brokers for trading according to the strategy: Quotex , PocketOption , Alpari, Binarium .
Trend lines and their analysis
In the classic version, the bearish trend line is drawn from the last two price lows. An uptrend is defined similarly, but instead of lows, highs are considered. However, there are other ways to determine a trend line.

The “DTL” strategy involves drawing a trend line along decreasing highs when there is a downward movement in the market and along rising lows when there is an upward movement. The strategy is based on drawing two trend lines, which is why it got its name (Double Trend Line). The main line is “Master”, the correction line is “Trigger”.

Reading Signals
The essence of the system is to enter the market when the price breaks through the correction line in the direction of the main trend. How to determine the points at which you need to buy an option?
First of all, you need to draw a trend line and wait for a corrective movement. When a rising low occurs, add a trigger line to the chart. As soon as it is broken, we enter the bearish market (PUT).

We do the same in a bullish trend. We draw the line “Master” and “Trigger”. After the breakout of the second one, we buy a call option (CALL).

Also, instead of the “Master” line, MA200 (moving average with parameter 200) can be used. The process of adding it to the chart is much simpler than finding price lows and highs. The moving average (MA200) also indicates a change in trend, which allows it to be used as an additional filter. If the asset price is above the MA, then we take CALL; if below, we take PUT.

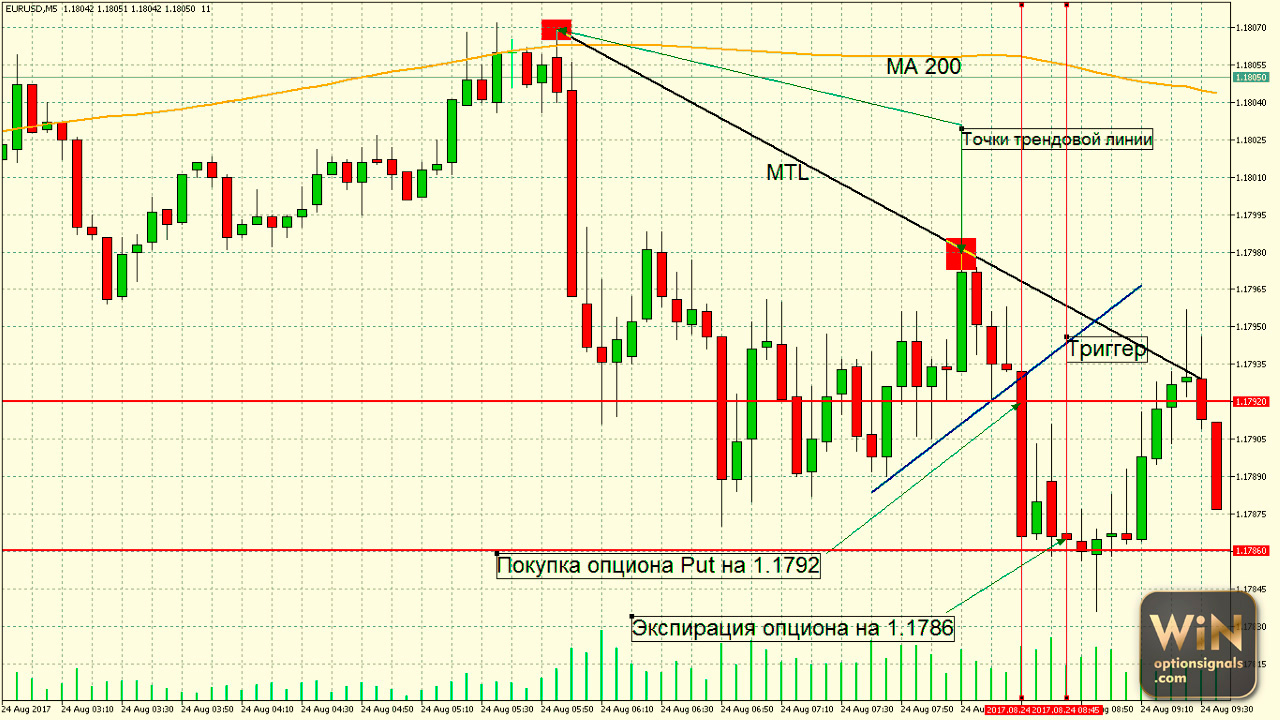
Let's consider a possible situation. For example, let's take the EURUSD chart with the M5 timeframe. Let's say the price is below MA200. As soon as a descending top appears on the chart, draw the “Master” line. Next you need to decide on the location of the “Trigger” line. It's 8.30 o'clock. The price breaks the trigger from top to bottom. Our action is to buy a put option at a price of 1.1792. We choose an expiration time of 15 minutes (3 candles). After this time we would have made a profit.
Trading rules are universal for all timeframes and assets. The only difference is the time frames chosen. For long-term trading, it is enough to wait for one candle to form. For intraday trading, it is recommended to increase the expiration period to three or more candles.
For example, for time frames M5 and M15, you should choose an expiration period of 3 or 4 candles. It is also very important to determine how active the market is. When trading on M1, expiration should be 5 candles. If you trade on H1 and higher timeframes, then one candle will be enough.

Example transaction
The first thing you need to do is install MA200. It will help determine the direction of the “Trigger” line. Let's assume that the moving average is pointing upward. Therefore, we will only consider CALL options.
As soon as two rising depressions are formed, we draw a trend line. Having reached its breakdown, we enter the market. The breakdown is considered complete if the candle closes behind the line. We buy an option to increase. Expiration – 3 candles (15 minutes). Now all that remains is to wait for the deal to close.
While there is a trend in the market, you can open an infinite number of transactions at each new correction. The main thing is that the price breaks the line.
The breakout candle also deserves attention. For example, candles with a small shadow are a clear sign of a rebound. In the opposite case (large shadow or body), it is recommended to refrain from opening a position.
You need to draw a line along the maximums. If it is already broken, then you can consider buying a CALL option with an expiration date of 3 candles.
Conclusions
The “DTL” strategy can be used when trading any assets and on any time frame, provided that there is a trend movement with corrections in the market. This situation is typical for almost every financial instrument. The expiration date is selected depending on the timeframe on which the analysis is carried out, and can be 1-5 candles. The potential of the considered strategy is quite high if all requirements and rules are strictly observed.
Can't figure out how this strategy or indicator works? Write about it in the comments to this article, and also subscribe to our YouTube channel WinOptionCrypto , where we will definitely answer all your questions in the video.

To leave a comment, you must register or log in to your account.