Each project in decentralized finance (DeFi) offers investors a lot of opportunities, but also hides many pitfalls. The rapidly developing DeFi ecosystem can be confusing not only for beginners, but also for experienced crypto enthusiasts. How to follow the most relevant trends , find promising protocols and not lose savings? In this article, we will tell you about the DeFi Llama platform, which will help you understand the complexities of decentralized finance and learn how to make balanced and informed investment decisions. Ready to dive into the depths of DeFi and not get lost in this sea of \u200b\u200bopportunities? Then you should definitely check out our detailed review of the DeFi Llama platform.
Content:
- What is DeFi and Why Will It Change Your Life?
- Overview of the interface of the analytical platform DeFi Llama
- Conclusion
What is DeFi and Why Will It Change Your Life?
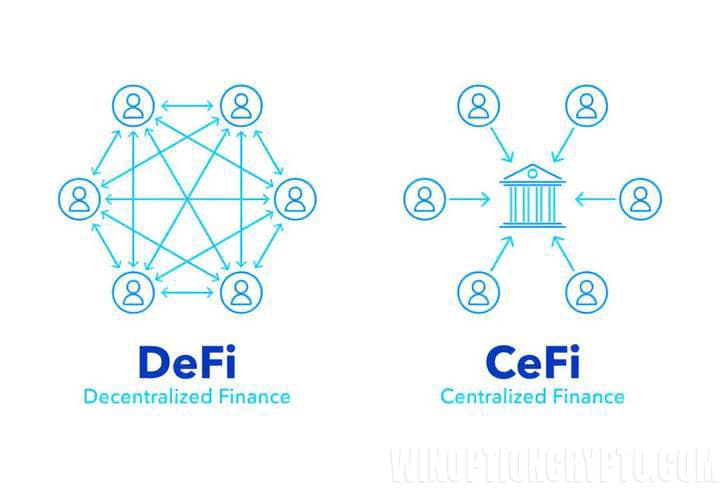 DeFi (from Decentralized Finance) is an acronym that stands for a new approach to finance based on blockchain . In simple terms, DeFi is financial services without traditional intermediaries such as banks or exchanges .
All transactions in this system, unlike traditional finance, are carried out directly between users using smart contracts. At the same time, only you have access to your funds, and no one can take them away, freeze or block them.
In addition to this, you receive special tools that allow you to increase your capital, receiving passive income .
What is the main goal of DeFi and what every beginner needs to know about it
First of all, they allow you to increase the number of assets in your portfolio automatically. Imagine that you have a few bitcoins or ethereum , and you can increase their number over several years. Thus, your income will be formed not only due to the growth of the exchange rate of the coins themselves, but also due to the increase in their total number in your portfolio. Every year you will have more and more of these cryptocurrencies . This is the main goal of DeFi - passive accumulation of assets.
Overview of the interface of the analytical platform DeFi Llama
Now that we have covered what DeFi is, it is time to get acquainted with the most popular open-source decentralized finance aggregator – the DeFi Llama platform. To understand what it is, imagine for a moment that you are a prospector working in a gold mine somewhere in the state of Nevada (USA), and you have a state-of-the-art metal detector. The metal detector is exactly what the DeFi Llama platform is.
The special charm of the project is that it is absolutely free, which means it is available to everyone. It is incredible how such a large arsenal of analytical tools can be freely available, but first things first.
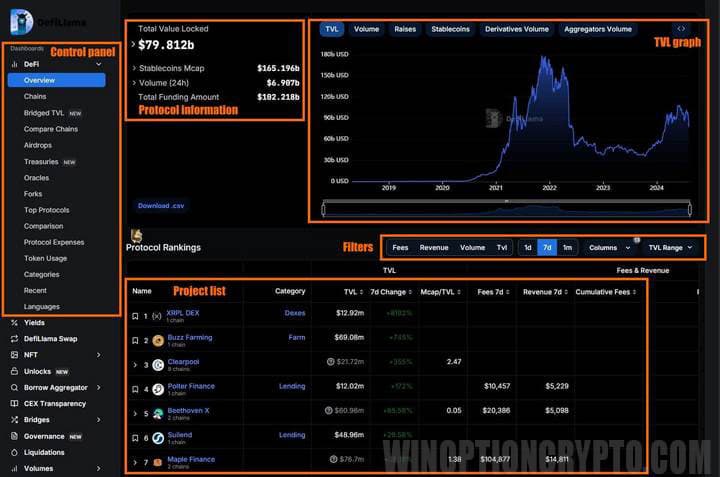
The DeFi Llama platform processes data from over 4,000 crypto projects and 11,000 liquidity pools, transforming huge amounts of blockchain data into easy-to-understand charts and tables. By going to the main section of the platform, we will get to a page with a TVL chart - the total value of assets locked in smart contracts of a certain blockchain, information on the protocol we are interested in or the entire DeFi sector, as well as a table with a list of projects that can be sorted and filtered.
DeFi
On the control panel on the left there is a drop-down list with available sections of the analytical platform. The most important of them is the DeFi section, which is divided into subcategories:
Overview
Here is information about all the locked assets in the DeFi ecosystem. At the time of writing, there is $79.914 billion locked in decentralized finance.
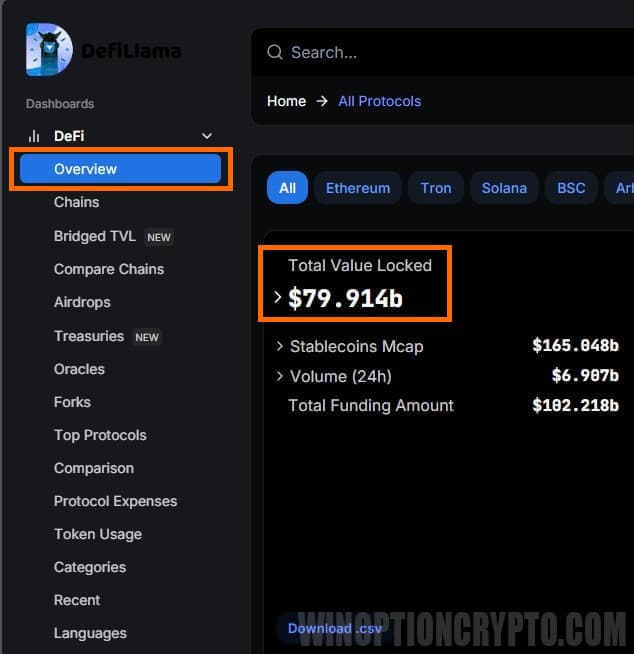
Moreover, the lion's share of these funds falls on the Ethereum, Tron and Solana blockchains with figures of $46.116 billion, $7.418 billion and $4.888 billion, respectively.
The chart allows you to monitor trends and changes in TVL over time for both DeFi as a whole and for each blockchain individually. If desired, the chart can be scaled and a detailed look at the period of interest can be viewed. You can also enable price display to visually assess the impact of TVL dynamics on the price of a coin of a specific blockchain, for example, Solana.
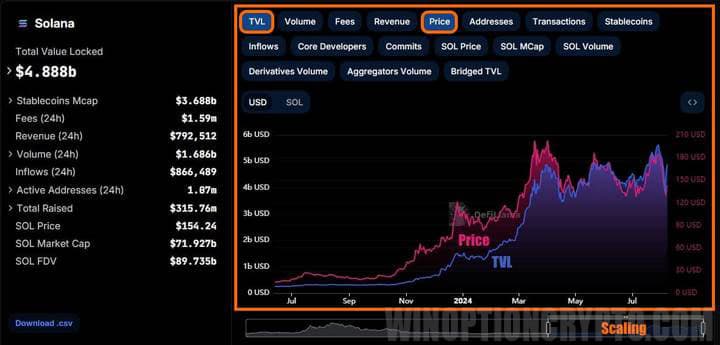
As we can see, the growth of TVL usually precedes the growth of the Solana coin rate, which may suggest favorable moments for buying this asset on the exchange.
How to quickly find a developing crypto project or protocol?
The easiest way to select promising projects is to filter them by the “7d Change” field, having previously set the minimum value of the “TVL Range” filter at $10 million. In this way, we will select projects with the maximum capital inflow for the week, excluding new projects with a TVL of less than $10 million, which are not yet particularly trusted by investors.
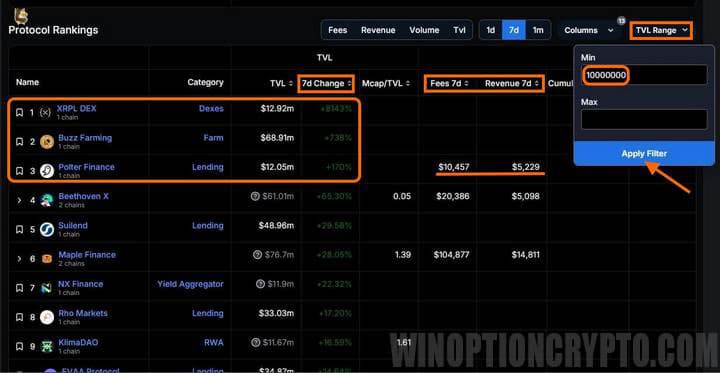
After applying all the above filters, the largest capital inflows were shown by the XRPL DEX protocol (+8187%), the investment strategy aggregator platform Buzz Farming (+376%) and the lending and borrowing platform Polter Finance (+174%). Moreover, the latter saw a commission increase of $10,457 over the week, and revenue of $5,229.
When we see a protocol grow by more than 90% in a week, it is time to figure out what caused the capital inflow. Maybe it was a certain promotion or the emergence of new pools where you can make money. Why is someone investing in these protocols right now? As a smart investor, you should figure out what caused this.
Chains
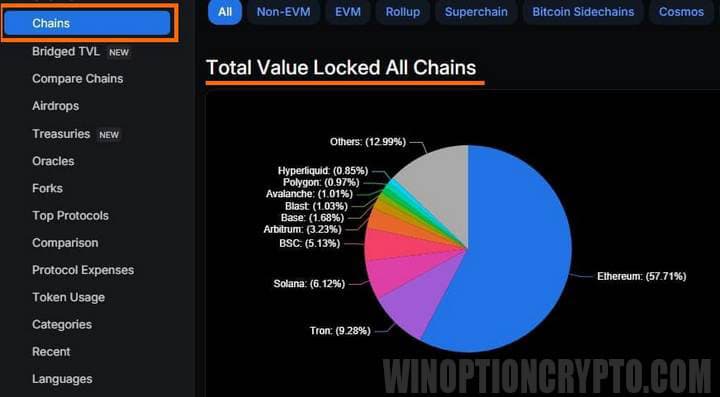
If in the “Overview” section we see information on different protocols, then in the “Chains” section data on different networks is collected. For example, how much money is blocked in the Ethereum, Tron, Solana, Arbitrum and other networks.
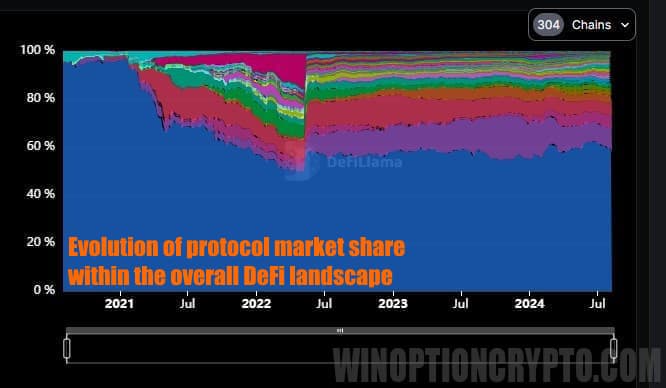
There is an additional chart on the right that shows the change in each network's share in the total DeFi volume. Simply put, this chart shows how certain protocols have lost or gained popularity.
Similar to the previous section, you can filter the table data and display a list of blockchains with the highest inflow of funds per week. However, you should be careful with this, because this list may contain “no-name” blockchains. Therefore, before thinking about buying their tokens, conduct a thorough analysis. Because in addition to the inflow of money over the past 7 days, there is also an outflow of funds for the same period.
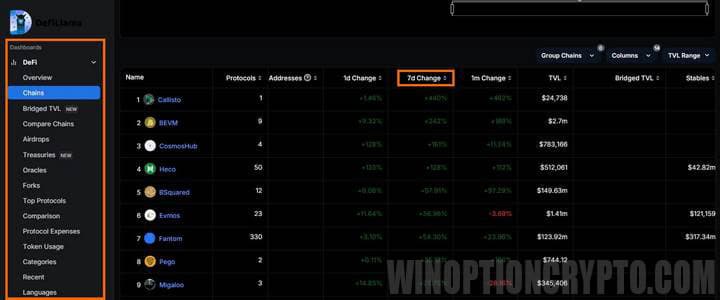
Bridged TVL for All Chains
This new section of the platform shows the liquidity that is transferred from one blockchain to another. In simple terms, Bridged TVL shows how much cryptocurrency has been “transferred” from one blockchain to another and locked in various decentralized financial applications (DeFi) on the new blockchain.
This allows you to see which blockchains are currently attracting the most capital and draw your own conclusions based on that. For now, this section is still under development: there are few filters to look at the data from different angles. Perhaps in the future, it will be expanded and supplemented, but for now, it has little practical application.
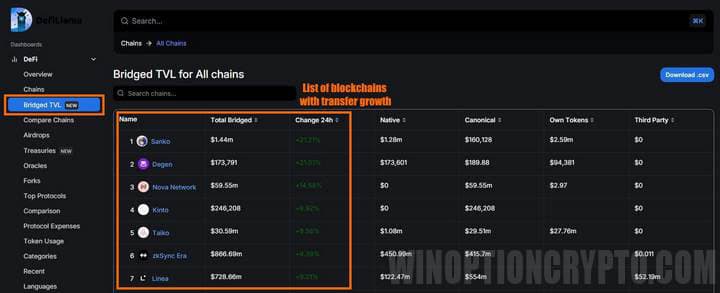
Compare chains
As the name suggests, this section allows you to compare different blockchains with each other, for example, BSC and Solana. You can compare them not only by TVL, but also by fees and revenue, for which you need to click the corresponding buttons above the graph on the right.
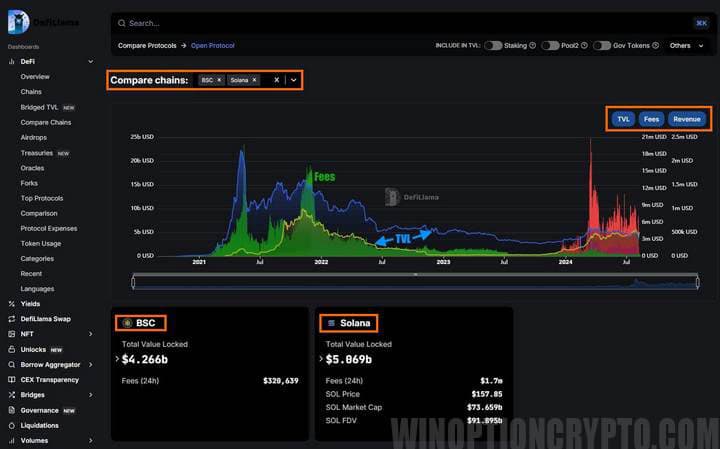
This can be useful for choosing a native token of a promising network that you plan to hold in your crypto portfolio for the long term.
Airdrops
This section presents protocols that do not yet have their own token. This means that in the future they may conduct airdrops - a marketing move to distribute their own tokens for free to users. The goal of such airdrops is to attract attention to the new project, expand the community, and stimulate the growth of the price of these tokens.
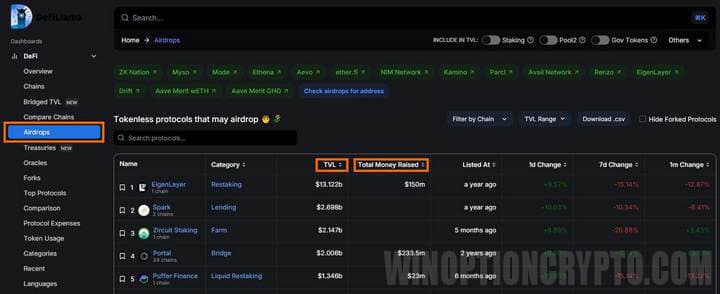
The table with protocol names should be sorted by TVL, as it reflects the level of trust in the project, its reliability, security and demand. It is also worth paying attention to the amount of funds raised, indicated in the “Total Money Raised” column. Attracting significant investments can be a harbinger of an upcoming airdrop, so do not lose sight of this point.
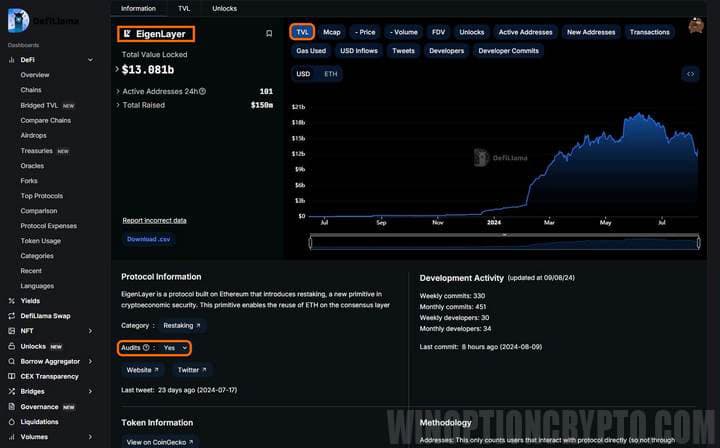
In addition, we can click on the name of any project and go to a page with additional information. For example, we are interested in the EigenLayer project. We click on its name, and a page with a TVL graph and detailed information on this project opens in front of us. Note that this protocol has been audited, which is indicated by a corresponding mark. However, keep in mind that this does not guarantee its reliability, although the presence of an audit still reduces the risk of fraud on the part of the owners.
It is worth carefully studying the audit report available at the link, as the audit may be conducted, but its findings may be negative. The fact that there is an audit does not mean anything, so check everything carefully. Also note that not all protocols from this list will distribute airdrops. We advise you to carefully study their social networks. Usually, if an airdrop is not planned, this is directly reported. At the same time, other protocols may actively attract people to testnets, which may indirectly indicate a possible future airdrop.
Treasuries
This section shows what tokens are in the various treasuries of the DeFi ecosystem projects' protocols. These tokens are owned and managed by decentralized autonomous organizations (DAOs). Treasuries can include various cryptocurrencies, tokens, stablecoins, and other digital assets. Their main task is to ensure the financial stability of the protocol, cover operating costs, facilitate project development, buy back tokens, etc. In simple terms, this section shows how much money a particular protocol has and where it is stored.
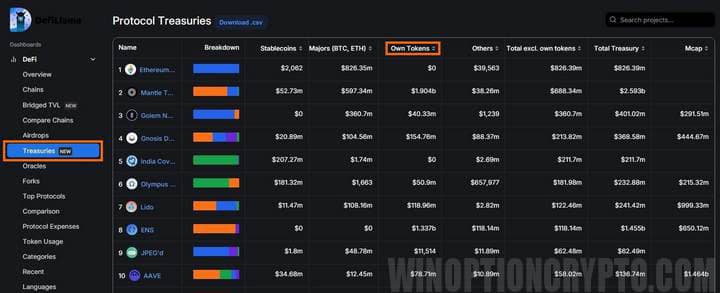
By diversifying their Treasuries, DAOs reduce the risks associated with cryptocurrency volatility and use them to reward community members, such as grants or airdrops. Additionally, holders of these tokens can vote on how to use the Treasuries.

A large value in the “Own Tokens” field may indicate potentially high risks, as the token was most likely added for sale. For example, the Mantle protocol has more than 73% of its assets in its own tokens, and just over 2% in stablecoins. This means that at any time the project owners will be able to sell them, which will have a very negative impact on the price.

For comparison, the India Covid Relief Fund protocol has 97.9% of its assets in stablecoins (USDC – this can be seen if you click on the protocol name and go to the project page), and the fund does not have its own tokens at all, as evidenced by the number 0 in the “Own Tokens” column.
Oracles
The Oracles subsection features real-world data providers in DeFi – special services that provide decentralized applications (dApps) with real-world data, such as asset prices, macroeconomic indicators , sports results, weather data, and more. All this information is delivered directly to the blockchain and then used in smart contracts to execute trades.
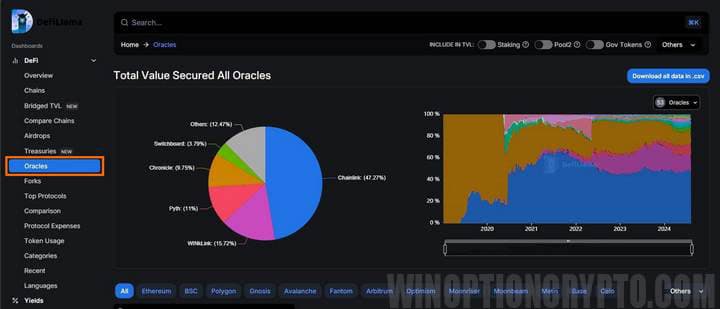
According to experts, the market volume of tokenized RWA (Real World Assets) will reach $10 trillion by 2030. Let us recall that tokenization is the process of converting a real asset into a digital token that can be bought, sold, or used as collateral in various DeFi protocols.
Thus, real estate, precious metals, works of art and other valuables can be used in decentralized financial systems (DeFi). Information about their prices will be supplied to the blockchain by one of those very “oracles”, and it is not difficult to guess what will happen to their native tokens. Therefore, we advise beginners to carefully study this section and understand what is displayed in it.
Forks
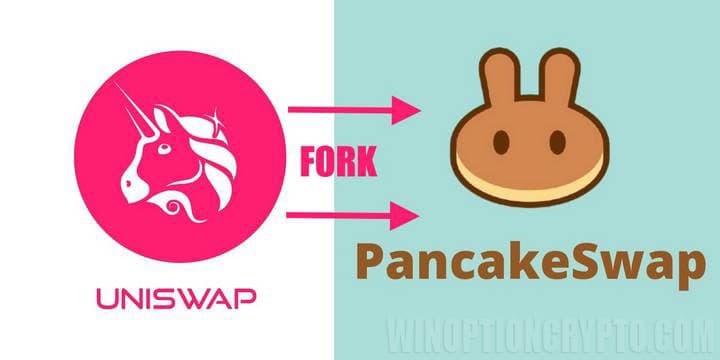
Many users of the DeFi Llama platform do not pay attention to this section, and in vain. In fact, it means a copy of an existing project under a different name. Initially, both projects are identical, but over time, the fork can develop along its own path, enriching the DeFi ecosystem and offering users new opportunities and options.
For example, they took the source code of the Uniswap project and created a fork of PancakeSwap. Forks can be either unchanged or, on the contrary, with improvements to certain project functions.
If you sort the table by the “Forks TVL / Original TVL” column, you can find protocols whose forks were significantly more successful than the original. The higher the percentage, the more successful the fork is compared to the original protocol.
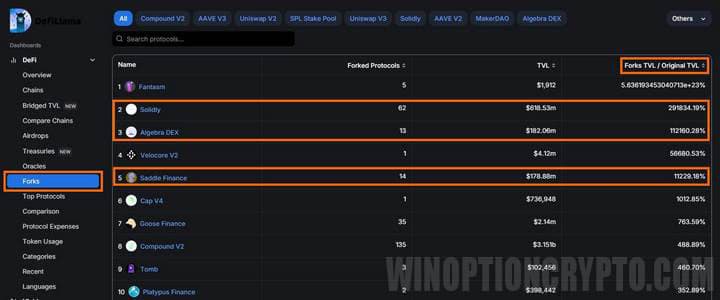
Don't forget to filter the received data by TVL level - it is not recommended to consider values less than $10 million. Thus, our "metal detector" found three very interesting protocols, forks of which deserve additional study: Solidly, Algebra DEX and Saddie Finance.
Next, you can go to each of these protocols and analyze their forks, having previously sorted the table with their list by TVL or percentage of change over the last week. However, keep in mind that all forks are successful for different reasons. Therefore, before buying a specific token, you need to do your own research: get to know the team, whether it is public or completely anonymous, study the roadmap of the project and its partnerships. Also, if the protocol from which a successful fork was made had airdrops, then most likely the fork itself will also conduct them.
Top Protocols
This subsection will be especially useful for those who are just getting acquainted with decentralized finance. It contains various projects, divided into categories. For example, you are looking for the best protocol for staking on Ethereum, so that the staked ether can be used in other protocols to get even more profit.

We choose the EigenLayer protocol. It allows restaking in the Ethereum network, as planned.
Comparison
If you need to compare competitors in one segment, go to the “Comparison” subsection and compare projects with each other based on the indicator you are interested in.
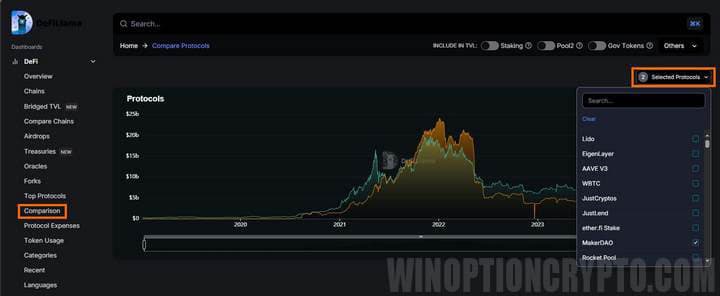
In the drop-down menu at the top, to the right of the graph, you can select the protocols you are interested in.
Protocol Expenses
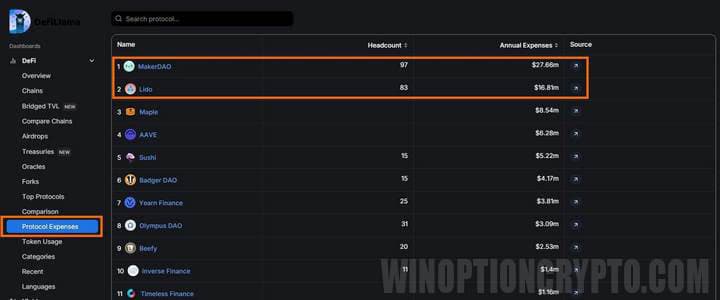
The "Protocol Expenses" tab reveals the secrets of some projects' expenses. It will be expanded and supplemented over time, but for now you can see how many people different projects have and what their annual expenses are.
Token Usage
Shows where the token is most often used. For example, Lido tokens are commonly used for Liquid Staking, and AAVE is used for Lending.
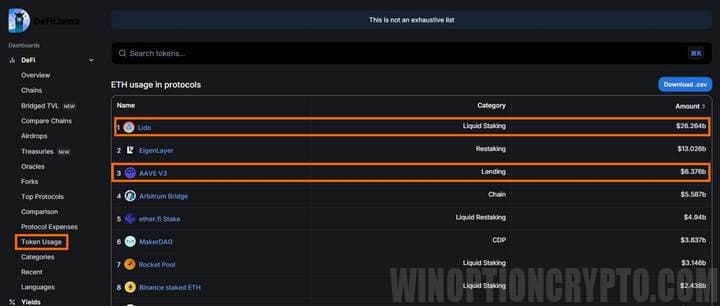
This way, you can find a real use for the coin, understand how deeply it is integrated into the decentralized finance ecosystem, and evaluate it in monetary terms, i.e. see how much money is in a particular protocol. Simply put, we can enter the ticker of our coin in the search bar of this subsection and find out in which protocols and for what it is most often used.
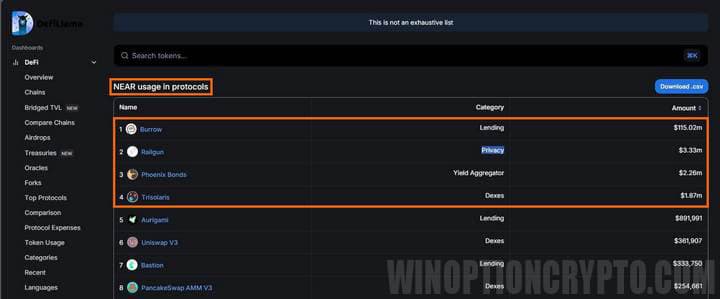
Let's say we're wondering how we can use the NEAR cryptocurrency . The DeFi analytics platform Llama will give us a comprehensive answer in no time: it's used in the Burrow, Railgun, Phoenix Bonds, and Trisolaris protocols for lending, anonymity, yield-seeking services, and decentralized exchanges.
Categories
In this section, you can take a closer look at the protocol categories to see which one is currently leading the DeFi ecosystem. It’s like the Google Trends of crypto. Only, while Google Trends is measured in search queries, in DeFi, prevalence is measured in the amount of funds locked in a particular protocol.
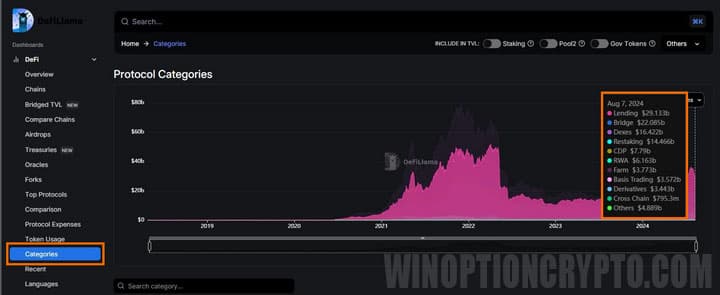
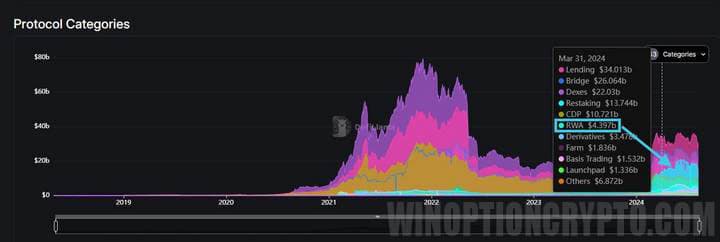
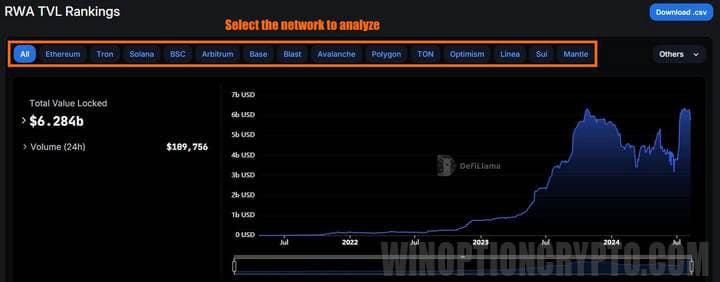
At the time of writing this review, the most popular were lending, cross-blockchain transfers (bridges), and decentralized exchanges (dexes). It is important to evaluate trends. The screenshot below shows how the RWA category, which we discussed earlier in this review, has been gaining popularity since the beginning of 2024.
If we want to know which protocols belong to this category, we need to find it in the table below the graph and click on the name.
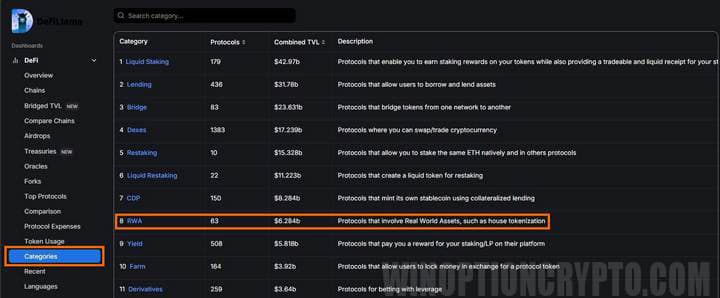
A table with a full list of protocols of the selected category will open in front of us. Now they can be compared with each other by checking the box in the "Compare" field opposite the protocols we are interested in and clicking the "Compare Protocols" button.
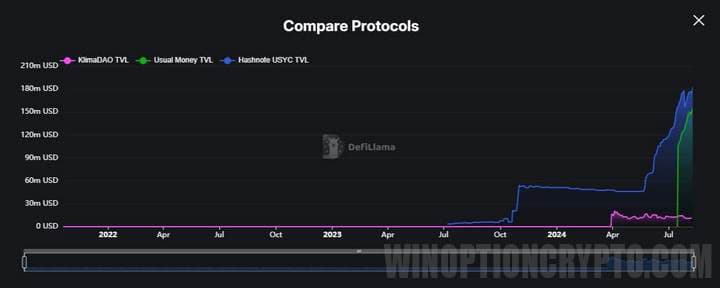
The graph clearly shows how long the protocols have been operating and how their TVL has changed over time. Moreover, comparisons between projects can be made not only across the entire market, but also in specific networks.
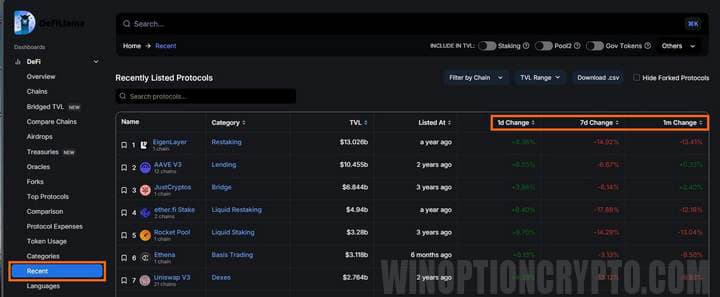
Recent
This tab allows you to track the change in the project TVL before others. Here you can sort projects by change per day, week and month, which helps to objectively monitor trends.
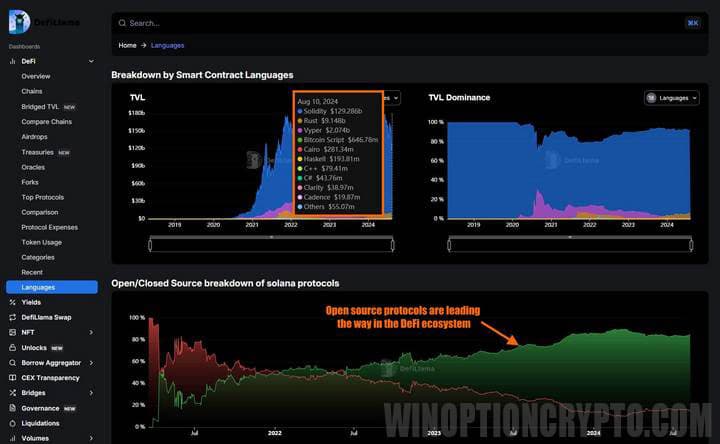
Languages
This tab shows which programming languages are most popular in blockchains. It also shows the trend in open source projects.
Yields
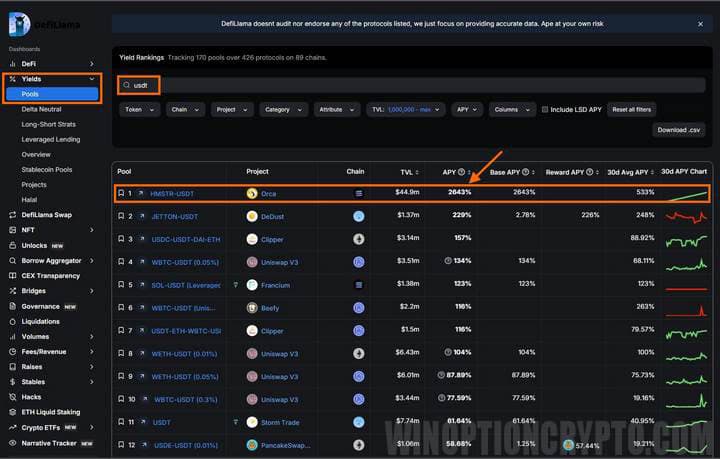
In this section, you can search for projects to maximize profitability. To do this, in the "Pools" subsection, you can see which coins currently have the highest profitability. By specifying the desired coin in the search engine, you will receive a list of pools with their annual profitability level and will be able to choose the one that suits you.
LlamaSwap
If you want to exchange your tokens, DeFi analytics platform Llama will tell you where to do it best.
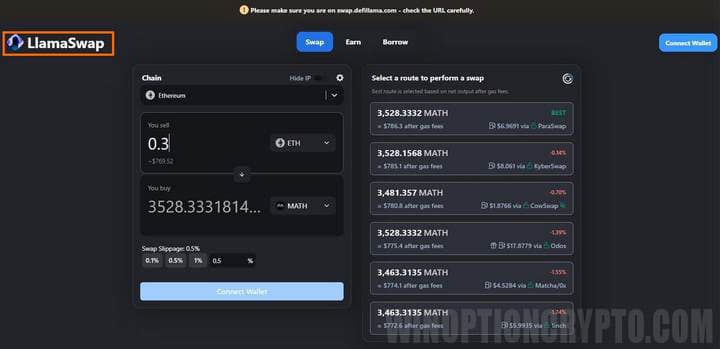
All you need to do is connect your wallet and make an exchange on the platform's site at the best rate. Another option is to go to the site with the best rate (indicated already taking into account the exchange fees) and make an exchange transaction there. It is not necessary to do this on the DeFi Llama platform.
NFT
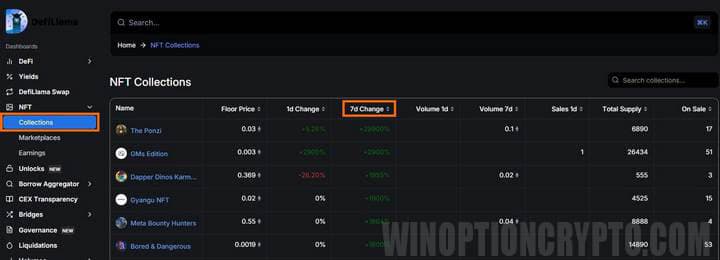
The platform has an NFT section, which consists of the “Collections,” “Marketplaces,” and “Earnings” tabs. The “Collections” tab lets you track all sorts of NFT collections, their prices, and the number of items for sale.
The “Marketplaces” tab allows you to analyze which NFT platforms have seen trading volumes increase and which have seen a decrease.
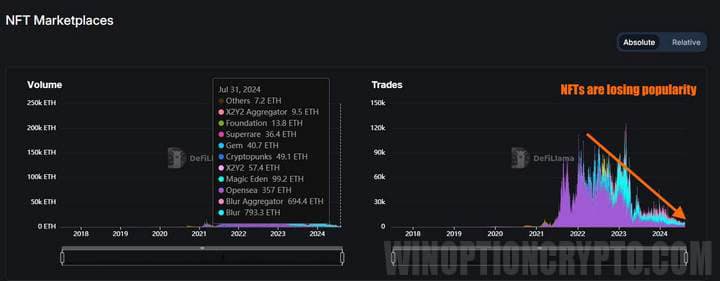
Overall, NFT trading volumes have declined significantly compared to 2022 and 2023.
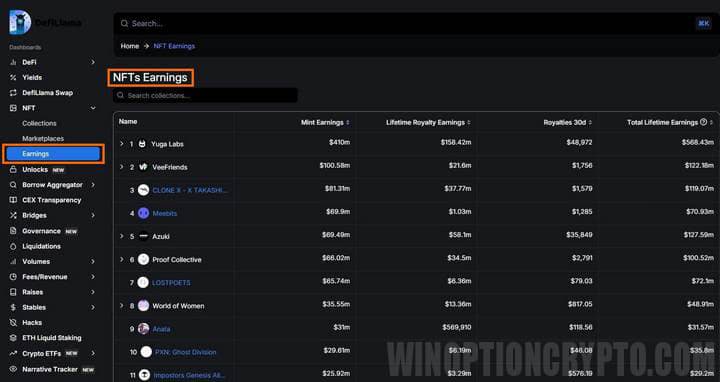
The “Earnings” tab allows you to see statistics on companies issuing NFTs: what is happening to them, how much they earn in royalties, etc.
Token Unlocks
Here is information about when locked tokens become available to early investors.
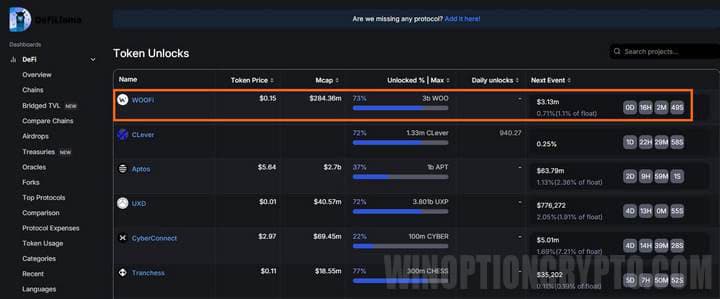
This information has a direct impact on the token price. If the project is about to have a token unlock and most of them go to investors, they will probably sell them, thereby putting pressure on the prices.
Borrow Aggregator
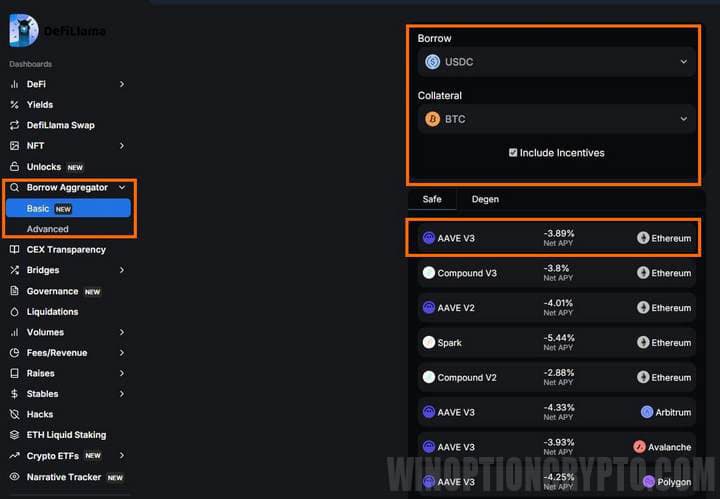
Here you can choose the most optimal option for borrowing the token you need. For example, if you need USDC and want to get it as collateral for bitcoins, the DeFi Llama platform will show you a list of protocols from which you can choose the most profitable option. In our example, this is the AAVE V3 protocol, in which we will pay (minus means writing off funds from your balance) 3.89% per annum on the Ethereum blockchain.
CEX Transparency
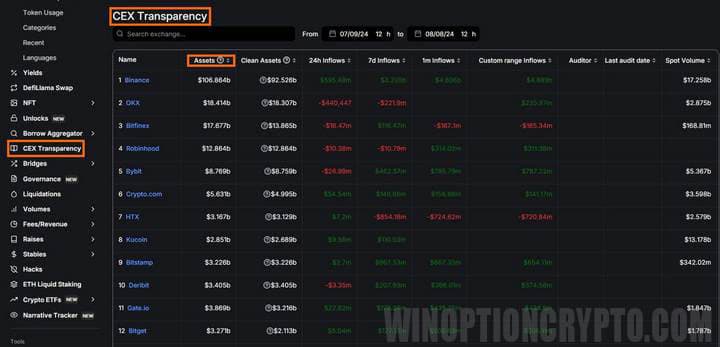
Here you can find information about centralized exchanges: how much money they have in wallets, net cash (excluding tokens that the exchange itself owns, its native tokens), how much it earns, and what its cash flow is. If you notice that an exchange is experiencing a strong outflow of funds, there may be something wrong with it, and you should think about withdrawing your funds.
Bridges
In this section, users of the DeFi Llama platform can find bridges to transfer their funds from one blockchain to another. For example, if you select the Solana network, you will see a table with a list of bridges that support this blockchain.
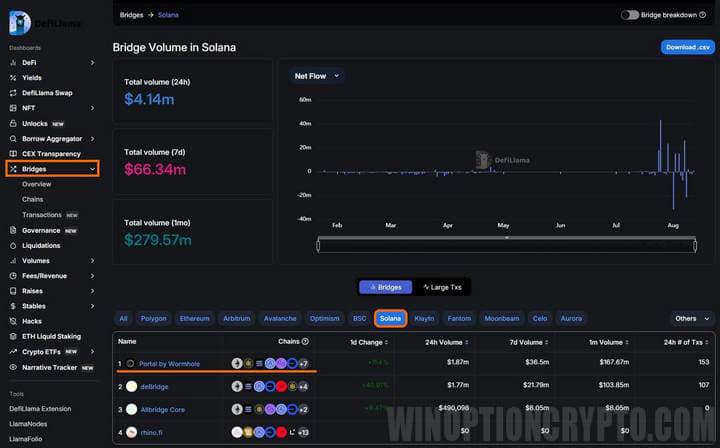
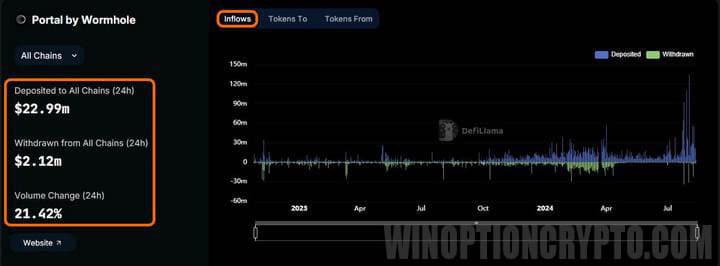
If you click on the name of one of them, a page will open with detailed statistics of transfers, broken down into categories: deposits, withdrawals and volume for the last 24 hours.
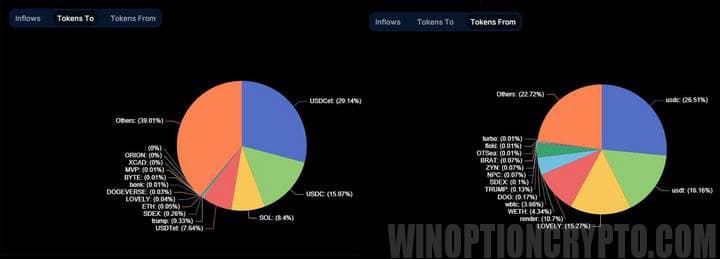
You can also see the statistics of transfers here: from which token funds are most often converted and to which.
Governance
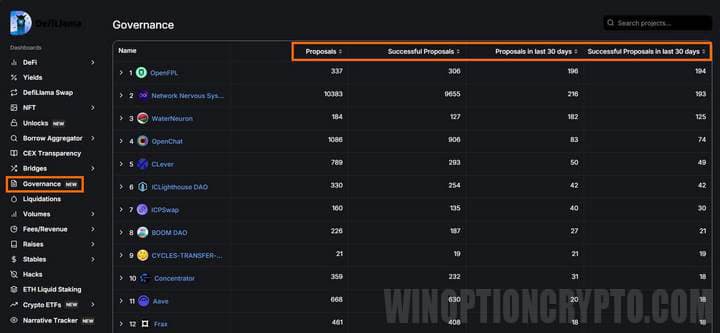
A new section on the DeFi Llama platform allows you to view statistics on proposals for various protocol improvements. You can see how many proposals have been made by participants holding governance tokens, how many have been accepted, and similar statistics for the last 30 days.
Liquidations
This section allows you to track liquidations of margin trades and leveraged positions on decentralized exchanges. For example, you can see the volume of liquidations by price levels on different platforms.
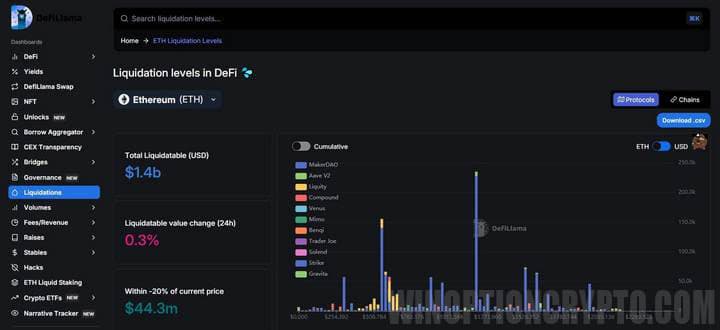
Volumes
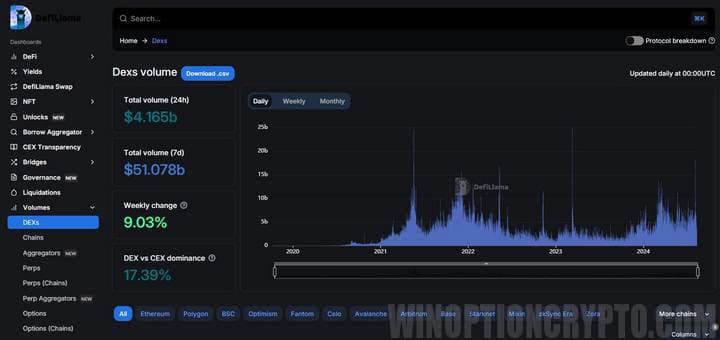
Here you can analyze the activity of various platforms: how actively decentralized exchanges, blockchains and aggregators are used. Based on the statistics provided, you can already make a decision about buying native tokens of these platforms or abandoning them.
Fees/Revenue
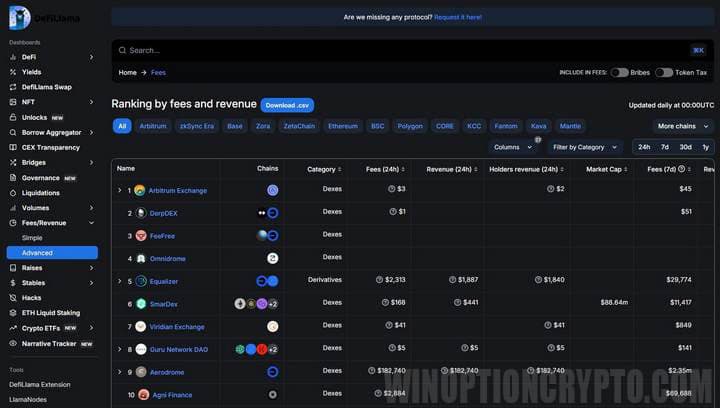
Here you can see statistics on paid commissions and profitability of various projects.
Raises
This section displays the investment amounts made in various projects. The table shows the protocol name, investment date and amount, round stage, purpose, key investors, links, valuation, and information about the blockchain and other investors.
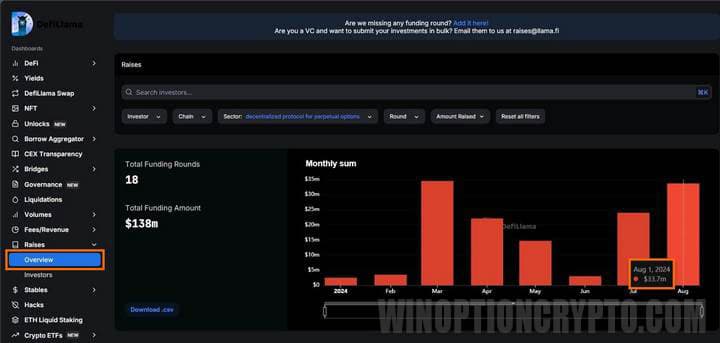
For example, $33.7 million was invested in the decentralized non-deliverable options sector.
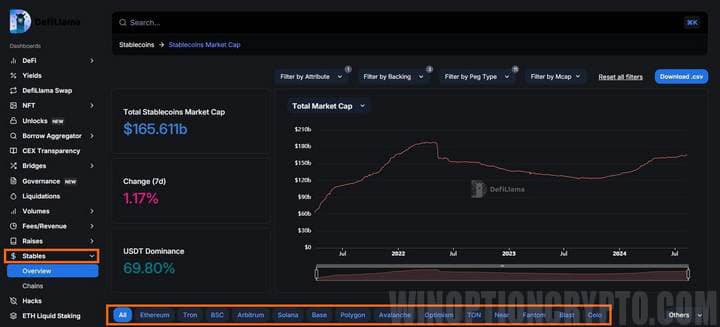
Stables
All information about the stablecoin market is collected here. You can see data on the change in market capitalization of the entire sector, as well as on specific stablecoins.
Hacks
This is a very important section. It contains information about protocol hacks. The table provides information about what exactly was hacked: the logic of the protocol or something else. You can see how much money a particular protocol or exchange lost, and also track the general trend in hacks.
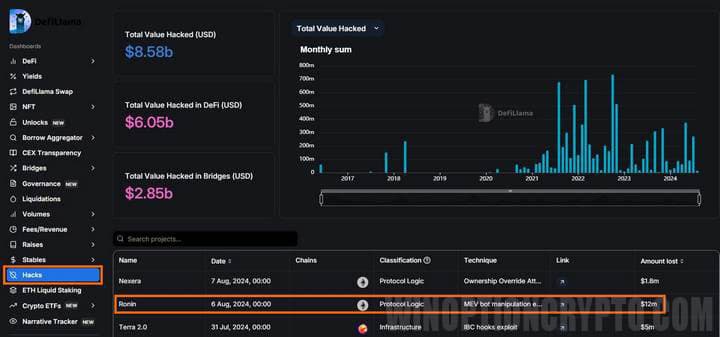
For example, on August 6, thanks to a vulnerability in the Ronin bridge software, hackers managed to steal about 4 thousand ETH and $12 million. Only the bridge's limit on the maximum transaction amount allowed the remaining funds to be protected from theft. Fortunately, these were ethical hackers who contacted the project administration and promised to return all funds for a reward and an indication of the security gaps in the software.
ETH Liquid Staking
Here you will find information on liquid staking in different protocols. How is it different from regular staking? In "classic" staking, your coins are "frozen" for a certain period, which means that you will not be able to use them until the lock period expires. In contrast, with liquid staking, you receive so-called liquid staking tokens (LST). These tokens represent your staked coins, but they are completely liquid. You can trade them, use them in other DeFi projects, or even borrow other cryptocurrencies against them.
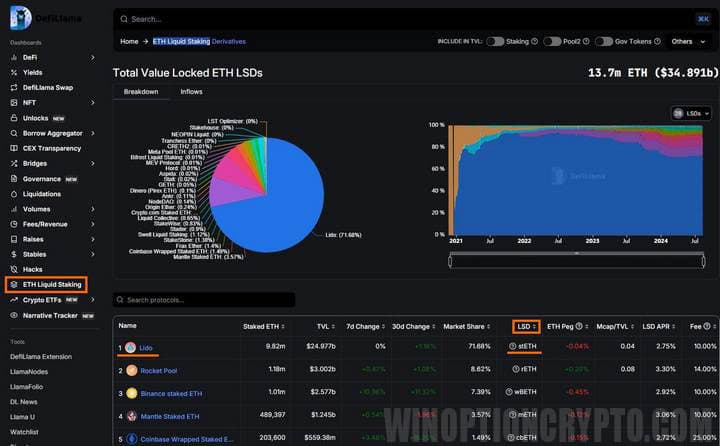
For example, your ETH staked in the largest project Lido will give you stETH, which you can invest in one of the liquidity pools. Thus, you will receive profit not only from the staking itself, but also from participating in the liquidity pool.
Crypto ETFs
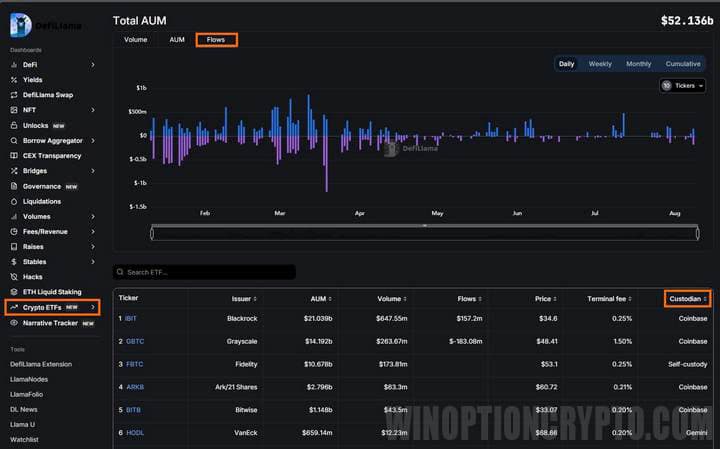
As the section name suggests, this section provides information on cryptocurrency ETFs on Bitcoin and Ethereum. The table contains data on issuers. The “Flows” tab is convenient for tracking the dynamics of capital inflows and outflows into these ETFs. Statistics are available for both BTC and ETH ETFs.
Narrative Tracker
In this section, you can see which sectors are trading better than others, as well as understand what has driven the growth of a particular sector of the cryptocurrency market.
![]()
In the "Heatmap" subsection you can see a heat map that will clearly indicate the leading sector at the time of writing the review - Solana.
![]()
The main advantage of this section is that it allows you to understand what has become the growth driver in a certain sector. For example, in the meme coin sector over the past month, the undisputed leader was MOG TRUMP, which showed a price increase of 2849.02%.
![]()
Conclusion
DeFi Llama is a guide to the fast-growing, disintermediated services in decentralized finance. It helps you track current trends, compare different protocols, and make informed decisions. However, as Charlie Lee, the creator of Litecoin, warned: “Cryptocurrencies are high-risk assets.” Be careful and remember that even the most promising projects can fail. DeFi Llama helps you minimize risks by providing access to detailed analytics and tools for monitoring various projects. However, the final decision is always yours.


To leave a comment, you must register or log in to your account.