
Live cryptocurrency chart from TradingView
Cryptocurrency charts: how to read
Exchanges that sell securities operate in the same way as platforms focused on trading cryptocurrencies. If you are an experienced trader in the classical sense of this term, then it will not take you much time to understand the chart of cryptocurrencies , for example, the same BTC. Problems threaten novice players. They risk losing money. Requires the ability to decipher price charts in relation to cryptocurrencies. Without knowledge of the same Japanese candlesticks, you cannot count on the success of transactions with digital money.
Stock charts are important. With their help, price changes are more clear. The picture wins against the background of information in the form of text or numbers. Through visualization, it is easy to see how traders behave and what the balance of power is. As a result, this allows you to predict how high the profitability of the transaction will be.

Types of charts
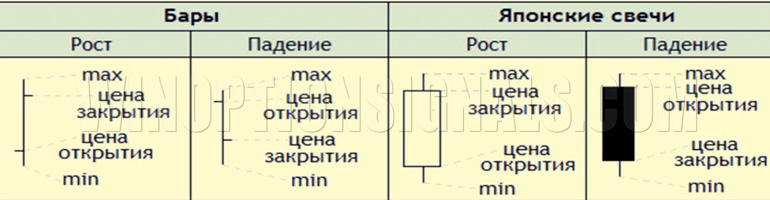
There are three main types of asset value visualization: Japanese candlestick, bar and line. The first two are formed for a specific period, when prices at the start and finish of the selected time period are taken into account. This refers to price minimums and maximums. As for the line graph, it differs from this picture construction scheme. In relation to it, only one information is used - closing prices.
The charts in question record how the price is updated for a specific period, measured in minutes, days or months, including a year. There is constant competition on the stock exchanges. The price is being rocked by bulls and bears. The dominance of some over others moves the graph curve up or down. Any of the peaks implies the conclusion of a large number of transactions. If the price goes up, this increases the profitability of some traders and causes losses for other players.
In this regard , the rate of cryptocurrencies, the online chart of which is constructed in this way, can be perceived as a reflection of human emotions. People's fear, desperation, greed and hope are all things that contribute to changes in asset values.
Japanese candles
The appearance of this chart is associated with the seventeenth century and the Japanese Munehisa Homma. Food exchanges existed even then. This rice trader invented an interval chart called Japanese candlesticks. This display of asset values has gained significant popularity in current trading.
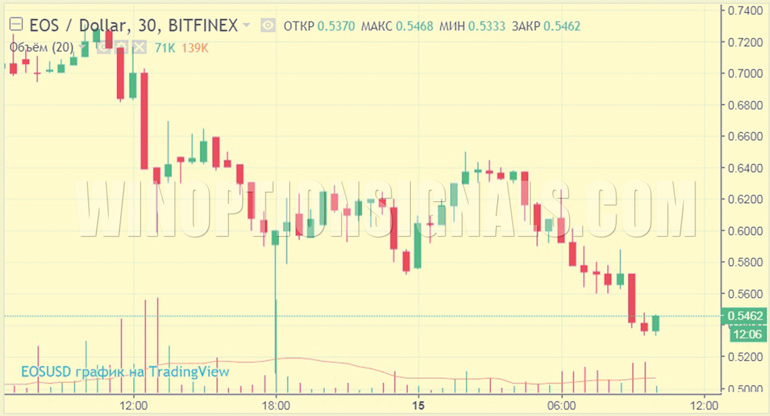
A regular real-time cryptocurrency chart does not provide the necessary comfort of price monitoring. With Japanese candlesticks things are different. Interval time division is used. This leads to a better understanding of the situation as a whole, which helps determine the trend.
The chart below shows 1 day. The interval size is determined by 1 hour. The color of a particular rectangle signals how different the opening price was in relation to the closing price.
How to read
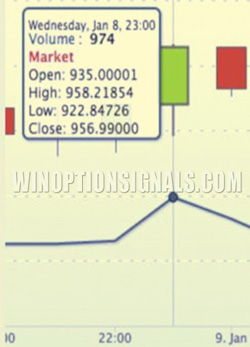
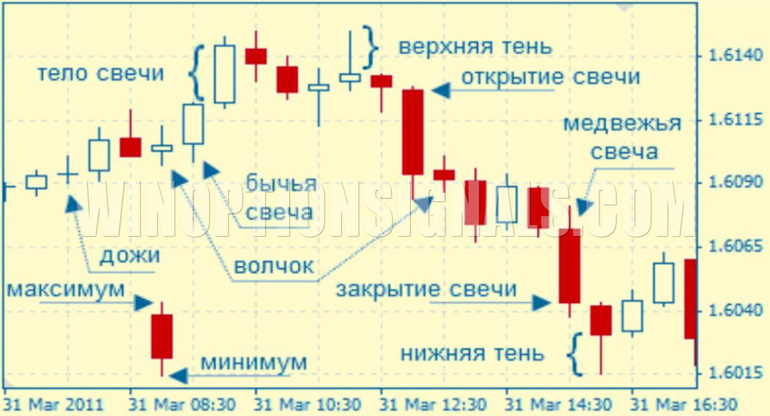
The body of the candle is the price of the asset at its minimum and maximum. Consider the date January 8 on the proposed chart. It can be seen that during the hour from 22:00 to 23:00 the maximum reached $958.21954, and the minimum reached $922.84726. The price of BTC at the start of the hour was $935.00001. By the end of the analyzed period of time, the rate was fixed at $956.99000. This resulted in the figure's body being colored green.
Lines that extend vertically from candles are called shadows. They were the reason why this type of live cryptocurrency chart got its name. Reminded me of the wick of a real candle. The length of such lines determines the prospects of the trend for the next period of time. If the upper shadow is longer than the lower shadow, then you can count on further growth of the trend. The opposite situation, characterized by a short upper part and a long lower part, serves as a signal that the exchange rate will fall.
To study the graphs, you should pay attention to the following parameters:
- period;
- volume;
- price.
The study of the schedule must be reduced to determining the balance between the components in the form of supply and demand. The vertical axis displays the price of an asset for a specific period, and the horizontal axis shows the number of transactions (volume). A cryptocurrency is analyzed, the rate chart of which is correlated with the parameters of its volume and price. As a result, it becomes clear what to calculate and how the balance mentioned above changes. It is guaranteed that you will take a profitable position even before the price moves up or down.
Reading example
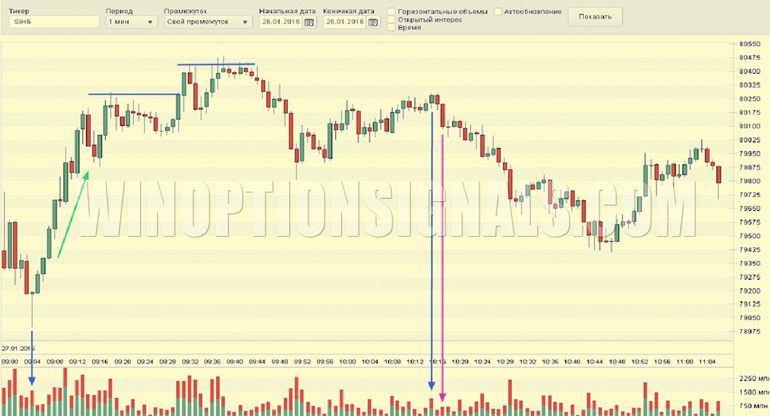
- The market has opened. The price went down, which became a fraudulent maneuver. The bears suffered a loss.
- The massive volume of purchases contributed to sellers going into the red. The graph is mostly green. A bullish sign is manifesting itself - assets are purchased at market prices.
- After the level of 80300, the breakout is reduced. New rises are characterized by smaller price increases. The bears are fighting back. At 9.45 the downward movement begins.
- At 10:16, the blue arrow shows a candle on the chart. The required growth has not been achieved. Buyers' initiative turned out to be insufficient.
- The red arrow signals that you need to open a short position. Signs of bearish activity appear, justifying a short. Sales volume prevails. There is a high probability of going down. A short is opened, for example, at 80100, where the target is 79500 and the stop is 80250. Buyers create conditions for a rise.
The considered transaction has potential, characterized by the following: profit – 600, probable losses – 150. The ratio is 1:4. When applied to a deal heading towards a successful conclusion, this is a good thing.
To acquire market reading skills, use an online cryptocurrency chart and a piece of paper. Close the part on the right, and then start moving the sheet in the same direction. Correlate the gradual opening of the graph with your conclusions about the essence of the analyzed processes.
To leave a comment, you must register or log in to your account.