Can you determine whether the price is reversing or just correcting, whether the trend is continuing or ending? There are a lot of disputes on this topic. However, all answers to this question are relevant only for one single piece of history. The situation is as follows: the beginning of a trend on a low time frame may turn out to be only a corrective price movement on a higher one, but a trend of an older period can also be a correction on an even higher time frame. And this can continue indefinitely. Such questions began to arise due to the formation of several warring camps of traders. Some of them prefer to trade using trend strategies, others – using counter-trend ones, and still others – using reversal ones. The funny thing is that they all strive for one thing - to find out the direction of the trend.
Today we will talk about a strategy called “Emerging from Oblivion.” It may well claim to be a strategy that can destroy existing market stereotypes.
Characteristics of the trading system:
- Trading platform: MT4 .
- Trading instrument: currency pairs.
- Working TF: 1 minute.
- Expiration time: 5 minutes.
- Time for trading : Europe and America.
- Brokers: Quotex , PocketOption , Alpari, Binarium .
Indicators used
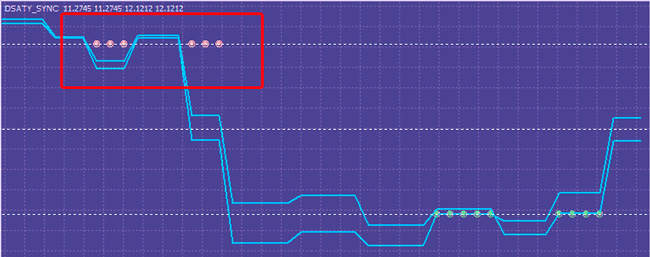
Let's start by looking at the DSATY SYNC indicator, which was developed by users of the TSD forum. The indicator includes two lines that act as a trend phase. The indicator belongs to the category of oscillators and, therefore, has specified maximum and minimum values, as well as an overbought/oversold zone (levels 10 and -10). When leaving these zones, the indicator points turn green or red, which is a signal of a possible trend change.
Synchronization of two lines confirms a change in trend direction. They simultaneously leave the overbought/oversold zone.
The indicator signals are of no interest to us. It is important for us that the lines are within the zones. Therefore, when receiving a signal from the indicator, we will not enter the market, since the reason for the appearance of this signal is the exit of its lines from the zone.
We need DSATY SYNC to determine the trend on a higher timeframe. Therefore, we will need two indicator options. One is installed on a chart with a 5-minute timeframe, and the other on a chart with a 15-minute timeframe.
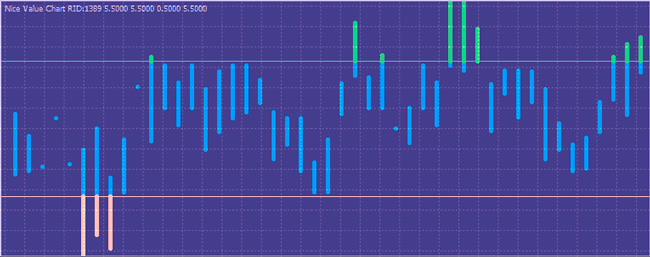
We will entrust the determination of the correction to the NVC oscillator, which is quite well known among traders. Its operating principle is based on calculating the deviation from the average price within a certain period, which is specified in the settings by the NumBars value. During the calculation process, an adjustment is made for volatility.
Trading rules for the “Emerging from Oblivion” strategy
The decision to enter the market is made in 2 stages. The first thing we need to do is determine the direction of the trend. For this, a chart with a higher TF is used. The second stage is the presence of a correction, which allows you to choose the most profitable entry point.
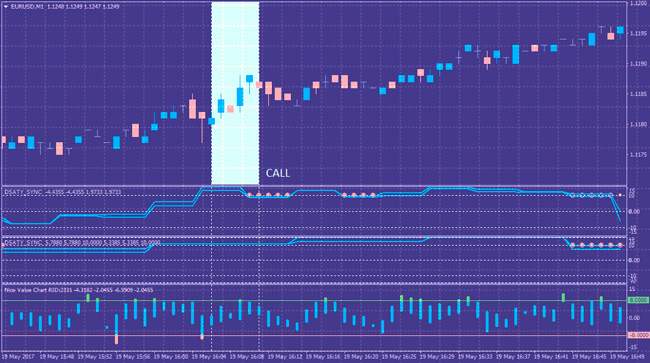
Buying a Call Option:
- Two DSATY SYNC lines are located above level 10 (overbought zone).
- The NYC bar is repainted red (entering the oversold zone).

The first thing we do is look at the higher time frame and determine if there is a bullish movement. DSATY SYNC copes with this task perfectly. On both timeframes, the lines must be below level 10. We ignore signal points. The only thing that matters to us is the location of the lines.
NYC works on a minute timeframe. Here we will look for the most profitable entry point. In other words, DSATY SYNC shows the main trend, and NYC determines the correction. An option is purchased on the next bar, a cut after the previous one closes in red.
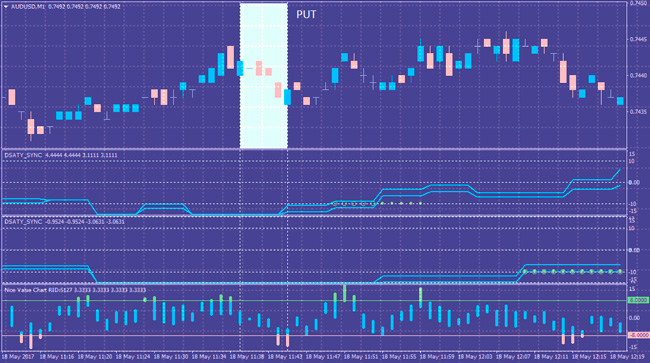
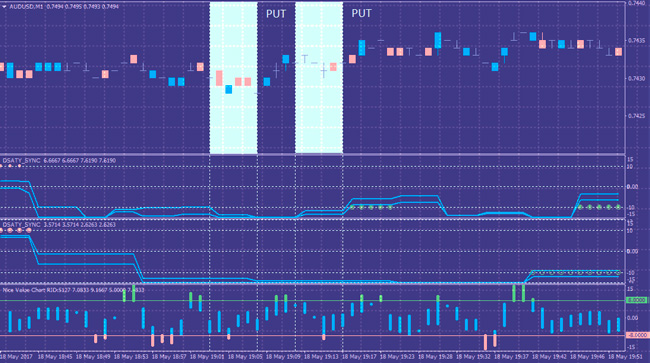
Buying a Put option:
- Both DSATY SYNC lines are located below the -10 level (oversold zone).
- The NYC bar is repainted green (entering the overbought zone).

The DSATY SYNC lines are below the -10 level (the closer to the minimum, the better). This picture suggests a strong bearish trend on a large TF. In addition, NYC should signal a correction (entry into the overbought zone). We buy an option on the next bar after the formed green one.
Trading recommendations
Like any trend strategy, “Emerging from Oblivion” implies the presence of sufficient volatility in the market. For this reason, trading during the Asian session is not recommended due to the low activity of market players. It is also at the discretion of the trader not to trade on Monday and Friday before or after the close of the European session. During these periods, the market situation is characterized by its unpredictability.
It is better not to trade at times of excessive volatility. The normal state of the market is indicated by the presence of a stable trend. However, consolidation is observed periodically. Important economic news can alarm the market. Consequently, trading using the system is carried out during the European and American sessions, except during the release of economic news.
At the very beginning of working with the strategy, try to trade only the most obvious setups. This refers to situations in which both DSATY SYNC lines have reached their minimum or maximum values. This approach allows you to minimize the occurrence of errors when determining the direction of the trend. Having gained experience, you can start trying to enter a little earlier, when the DSATY SYNC lines are just entering the overbought/oversold zone.
Application of strategy
We immediately pay attention to the location of the lines of the DSATY SYNC indicator on the 5-minute timeframe. We see that they are entering the zone above level 10. At the 15-minute timeframe, these lines are already in this zone. The NYC indicator begins to go down and turn red, which tells us that the corrective movement will soon end. We buy the Call option as soon as the bar closes and NYC does not change its color.
In some cases, an expiration time of 5 minutes may not be enough for the trade to be profitable. For example, this happens at the opening of London, when the market has just begun to gain its volumes. This is the case when the expiration time should be increased, but not more than 10 minutes.
In the case of a Put option, the indicator signals should be opposite.
Now let’s look at a situation in which it is not recommended to enter the market. Let's say the indicators show the ideal setup for opening a trade. However, we see that market liquidity is, to put it mildly, very low. This is expressed in the fact that the price practically does not move, forming a doji on the chart. A similar situation may occur during the London lockdown.
Conclusion
Trading with the trend is considered one of the safest. By following the trend, we do not need to reveal the hidden intentions of traders. As soon as we notice a strong movement, we immediately begin to look for an entry point. The “Coming Out of Oblivion” strategy allows traders to rid themselves of established market stereotypes and take a different look at binary options trading.
Download strategy files “Emerging from Oblivion”
Can't figure out how this strategy or indicator works? Write about it in the comments to this article, and also subscribe to our YouTube channel WinOptionCrypto , where we will definitely answer all your questions in the video.
See also:




To leave a comment, you must register or log in to your account.