Among the tools used by traders when carrying out speculative operations, the most accurate results in binary options are provided by technical analysis, which in practice is more convenient to use using data from indicators. The latter demonstrate good efficiency on various timeframes. However, most indicators redraw charts, give insufficiently accurate signals, or are late. Technical analysis tools that do not have these disadvantages are especially popular among traders, as they make it easier to find the optimal moment to enter the market.
Why are indicators without redrawing effective?
 Indicators that promptly signal the need to open a deal and do not redraw charts are popular because they allow you to find moments to enter the market with fairly high accuracy when trading binary options.
Other tools do not provide such capabilities. On the contrary, such indicators often change trading signals during the selected timeframe, thereby increasing the risk of losing a deposit. These situations can be described as follows:
- The trader, using a certain indicator, looks for a point to enter the market.
- The indicator shows (with arrows or in another way) that at the current moment in time it is necessary to open a transaction, for example, to buy an asset.
- The trader opens a buy deal.
- After placing an order, the indicator is redrawn and shows that the transaction should have been opened to sell the same asset (in the opposite direction). As a result, the trader loses his money due to an unreliable signal.
Some traders suggest that indicators give inaccurate signals “on purpose.” That is, this possibility is built directly into the program code. However, most traders tend to believe that inaccurate forecasts are due to outdated or ineffective algorithms on which the indicators operate. The market is a rapidly changing mechanism, so instruments that were recently profitable are becoming irrelevant today.
 The second disadvantage of many indicators is that they provide signals with a certain delay. The delay is explained by the fact that the algorithms are based on averaged values. Thanks to this, indicators smooth out market fluctuations, small pullbacks and impulses. This solution increases the accuracy of the generated signals. But because of this, the indicators lag, as a result of which traders often waste time and miss the optimal opportunity to enter the market. Therefore, many of them use indicators in practice, the signals of which correspond to the chosen strategy.
Adhering to this approach is highly discouraged. In certain circumstances, this strategy can result in significant losses. Traders should use indicators that not only produce accurate results, but do so consistently.
Instructions for installing indicators in MetaTrader 4 :
Types of indicators
Developers cannot offer indicators that consistently provide signals with 100% accuracy. Each such instrument periodically displays values with some error. In addition, quite a few indicators have been created that are capable of not only outputting signals in a timely manner (without lag), but also not changing over time (not redrawing) previously provided data.
Conventionally, technical analysis tools are classified into the following groups:
- Trending. Indicators of this type are included in the basic package of almost all trading platforms. Such tools are distinguished by fairly accurate forecasting and the absence of redrawing (this is rare). But trend indicators often lag. Therefore, traders recommend using these tools to confirm signals. ADX and SMA are considered popular trend indicators.
- Flat. They are used during the period when the asset is in the price corridor. The latter refers to a situation in which the value of an option changes within certain values, and the chart moves sideways. With such parameters, oscillators are often used to enter the market, among which Stochastic stands out.
- Counter-trend . They are used when prices roll back from current values. Similar situations arise when, for example, the value of an asset constantly goes up, but decreases for a certain period of time. Using a price pullback strategy, traders can open positions against the current trend. In this case, Bollinger waves are considered an excellent tool, they give timely signals and do not redraw.
- For scalping . This strategy involves opening several transactions simultaneously in a situation where there is a slight fluctuation in prices in the market. Tools used for scalping should not lag or redraw. The main disadvantage of such indicators is that they often give inaccurate signals. When working on a low-volatile market, it is recommended to use BinaryCash, Scalper Dream and a number of other tools.
- Signal (arrows) . Indicators of this type are based on complex algorithms, which make working with technical tools easier. Traders do not need to wait for patterns to form. The indicator signals the optimal entry points into the market by displaying arrows or dots on the chart. Some tools provide an audible alert.
Among the indicators listed above, it is worth noting the arrow indicators, since they provide signals without delay and are rarely redrawn. However, a trader should not rely solely on these tools. Arrow indicators only show potentially profitable moments to enter the market. The trader must make the final decision based on his own analysis of the chart and other indicators.
Indicators for scalping also fit the above conditions. However, these tools have one major drawback: they often provide inaccurate signals.
Types of indicators for binary options trading
Indicators without redrawing or lag, used for trading binary options, are distinguished by the fact that they provide several signals for entering the market. Thanks to this, the trader can choose the optimal moment to open a transaction. The nature of the signals from the indicator does not change in the future.
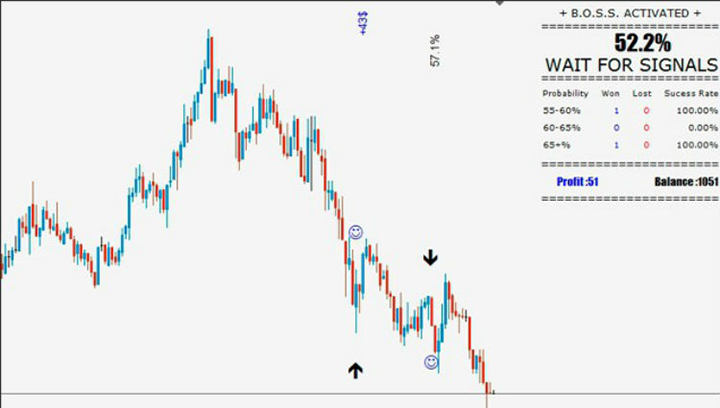
BOSS
The advantages of using the BOSS binary options arrow indicator include the following:
- high level of profitability, reaching 69%;
- complies with the rules of money management;
- In addition to the arrows, the indicator signals the entry point through messages.
The BOSS switcher is suitable for working on a 15-minute timeframe. You can achieve effective trading using this indicator if you follow several rules:
- An arrow is formed on the chart at the moment when a new candle begins to form. Therefore, you should enter the market as soon as the signal appears. At this moment, a message appears in the corner of the screen about the need to open a deal to buy an option or.
- When the arrow is pointing up, you need to open a deal to buy an option.
- If the arrow is pointing down, you should place a buy order.
The second distinctive feature of BOSS is that the indicator rarely gives false signals.

Download the BOSS indicator
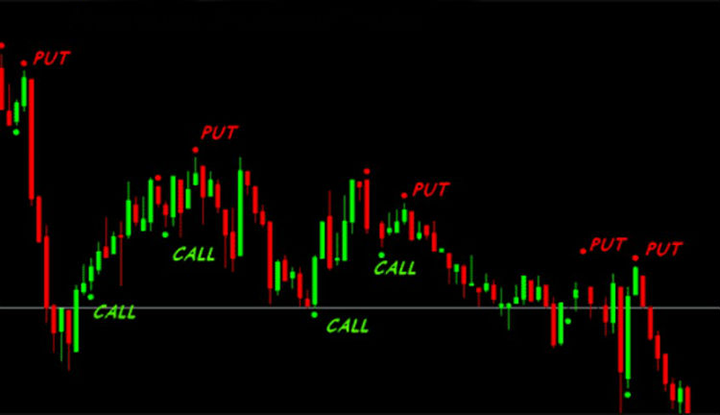
Six Seconds Trades
The arrow indicator for binary options Six Seconds Trades is recommended for working with a scalping strategy or turbo options. The indicator has a relatively simple interface. The one-minute chart is considered optimal for Six Seconds Trades. The principle of working with this indicator comes down to the following rules:
- The green arrow on the chart indicates the need to purchase an asset (purchase option).
- The red arrow signals the sale of an asset (buying an option).
- It is necessary to open a position when the bar or candle closes, above or below which the signal appeared.
The Six Seconds Trades switcher behaves better in a volatile market. Therefore, it is recommended to use the tool for trading the most popular currency pairs. This indicator can be classified as shareware. The regular version of Six Seconds Trades provides delayed signals. You will have to pay for a tool without this drawback.

Download the Six Seconds Trades indicator
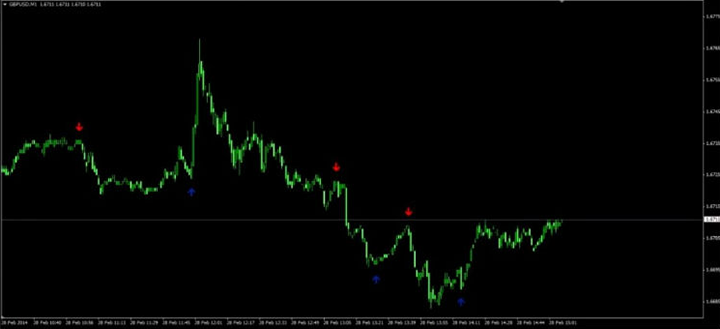
KILLBINARYSIGNALS-2
This arrow indicator is one of the most popular, as it does not redraw and gives timely signals about entering the market. Moreover, to work with binary options, it is recommended to use the second version of the instrument, since the first often changed values during trading.
If KILLBINARYSIGNALS-2 forms a blue arrow on the chart, you need to open a deal to buy a CALL option; red arrow - PUT option.
The algorithms on which this indicator operates take into account the following indicators:
- the strength of the volatility of the selected asset;
- the risk of a breakdown or price rollback;
- support and resistance levels;
- the nature of changes in the value of an asset in relation to other important price levels.
A number of sources on the Internet provide information that the KILLBINARYSIGNALS-2 arrow indicator allows you to make a profit in 97% of transactions. In practice, the situation looks somewhat different. However, the indicator is really highly effective.

Download the KILLBINARYSIGNALS-2 indicator
Most technical analysis tools can be built into the MT4 platform without redrawing or delay. Internet portals in rare cases allow the use of additional indicators. Almost all web platforms support built-in tools exclusively. At the same time, traders can take advantage of live charts (in particular, TradingView), which allow them to install additional indicators.
Can't figure out how this strategy or indicator works? Write about it in the comments to this article, and also subscribe to our YouTube channel WinOptionCrypto , where we will definitely answer all your questions in the video.
See also:
Free online signals for binary options
Accurate arrow indicators for binary options


To leave a comment, you must register or log in to your account.