
Dow Theory describes the movement of stock prices (securities) within a selected time period. It appeared in 1900-1902 and is named after Charles Dow, the first editor of The Wall Street Journal. The author was unable to complete his work because he died in 1902, but later Robert Rea, George Schaefer and William Hamilton completed it, naming it after Charles Dow.

Content:
- The essence of Dow theory (including for binary options);
- Charles Dow: A Brief Life History;
- What is price “memory”?
- Types of trends according to Dow theory;
- Main trend;
- Secondary trend;
- Slight trend;
- Application of the Dow Theory in binary options trading;
- Three phases of a trend;
- Accumulation phase;
- Participation phase;
- Implementation phase;
- Final Tips for Trading Binary Options Using Dow Theory;
- Dow Theory: indices should confirm each other;
- The trend is confirmed by trading volumes;
- Trend reversal in Dow theory and binary options;
- Technical analysis and Dow theory: summary.
The essence of Dow theory (including for binary options)
All technical analysis is based on this theory. It is based on 6 postulates that most traders rely on when making decisions and making forecasts:
- There are three types of trends , each of which is characterized by its own characteristics.
- All primary trends are divided into 3 trend phases .
- The market always reacts to news events and has a memory.
- All stock indices must be consistent with each other and confirm each other's behavior.
- The current trend must be confirmed by the volume of trading .
- The trend ends only if there is a clear signal about its termination.
Each of the described postulates plays an important role in trading.
Charles Dow: A Brief Life History

Charles Dow is known to people who are involved in finance, not only as the founder of the theory in question, but also as the first editor of the famous magazine The Wall Street Journal. This man was also one of the founders of Dow Jones and Company. That is, Dow's activities have always been dedicated to the world of finance and the events that occur around them.
Charles Dow lived from 1851 to 1902. He earned his first income as a reporter at a news bureau based on Wall Street. Thanks to this, Dow was able to meet Edward Jones, with whom he founded his company in 1882. At first, Dow Jones and Company specialized in publishing news booklets that covered world events in finance and trade, but 2 years later the partners launched The Wall Street Journal.
Reporting and editorial work allowed Dow to delve deeply into the world of finance. He constantly communicated with major industrialists and bankers, which created certain conditions for the creation of work, which in the future was called the Dow theory. Communicating with representatives of the financial world, Charles Dow was able to identify certain patterns. In particular, he was able to understand how events that happened in the past affect current prices.
In 1893, Charles Dow came to the realization that it was necessary to create some kind of indicator that would help track market activity. His appearance was relevant at that time. At the end of the 19th century in the United States, there was a sharp increase in speculative transactions in the market, as mergers of various companies often occurred. As a result, Charles Dow developed a new index called the Dow Jones Industrial Average. It was calculated as the average price of 12 companies (today it takes into account the 30 largest American companies).
It was also during this period that Charles Dow came to the realization that all prices have a “memory.” That is, they contain some events that happened in the past. But Dow was unable to complete this theory. This issue was resolved by other experts after the death of the editor.
What is price “memory”
According to the Dow theory, all events that occur in the world are necessarily reflected in the price of assets. Moreover, this applies to information not only from the past and present, but also from the future. The latter can be explained as follows: investors, in anticipation of a favorable event (payment of large dividends), buy shares. As a result, the asset becomes more expensive. That is, its price includes a situation that has not yet occurred.
According to Doe, “memory” stores many events. It can be:
- emotional mood of the market and individual participants;
- acquisition or spin-off of companies;
- global and local economic crises;
- innovations (any, including scientific, technological, etc.);
- entering the market of new products and more.
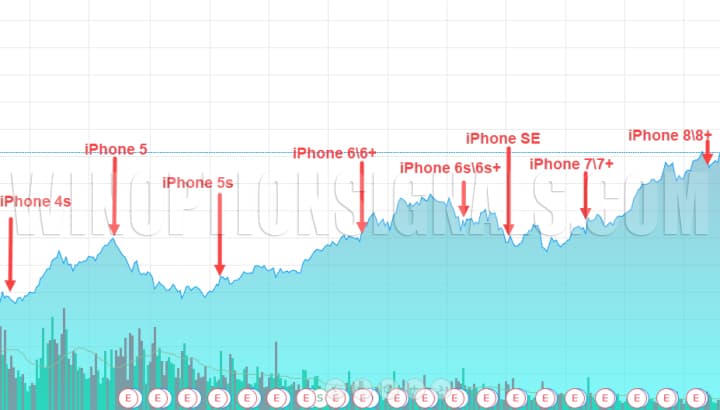
By examining the history of trading assets in binary options, according to this theory, it is possible to identify events that had a direct impact on the formation of the price of an individual asset. A striking example confirming this rule is the annual presentation of Apple, during which it shows new products. Immediately after the event, share prices of the American IT giant rise. This is due to at least two reasons. First, investors are confident that the products presented will sell. Secondly, they extrapolate their forecasts to the past, which proves the accuracy of the forecast made. Previous Apple products have also sold well. In addition, the compiled forecast shows the probabilistic future. All 3 factors are taken into account in the value of the asset.
All events that directly relate to a specific stock, currency pair , cryptocurrency (news, history of success/failure of goods, etc.) are included in the price. Thanks to this, investors can view graphs of the asset's past behavior and make a rough forecast of its behavior in the near future if similar events occur.
That is why, according to the theory under consideration, the price has a “memory”. Binary options traders try to take these circumstances into account when making forecasts. Currently, traders use many different technical tools ( indicators and strategies ) to carry out such analysis. With their help, it is possible to identify patterns in price movements. Thanks to this, binary options traders are able to find the optimal moments to buy and sell assets. Moreover, these tools, which track patterns in price movements, can be used for intraday trading with binary options.
Charles Dow used his discovery to analyze the market as a whole. That is, he tracked changes in the value of only large companies, assessing their impact on prices. As a result, the Dow Jones Industrial Average was created to simplify this process. This tool allows you to determine the market mood. For example, if the index is growing, then this indicates a “bullish” trend . In such situations, investors actively buy up the assets of various enterprises (not only those that are taken into account by this index). In addition, the Dow theory is used to assess the financial condition of companies, since it takes into account certain patterns in its formation.
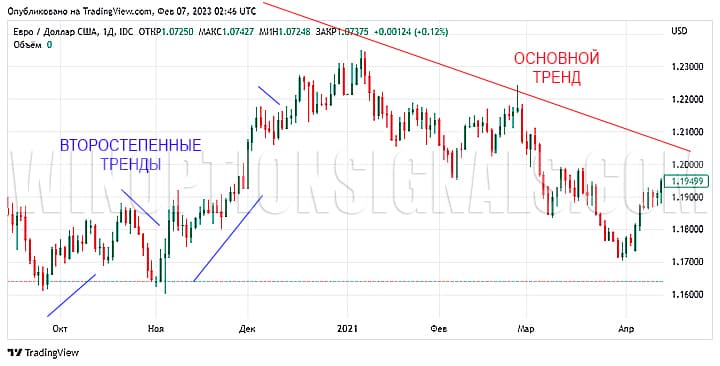
Types of trends according to Dow theory
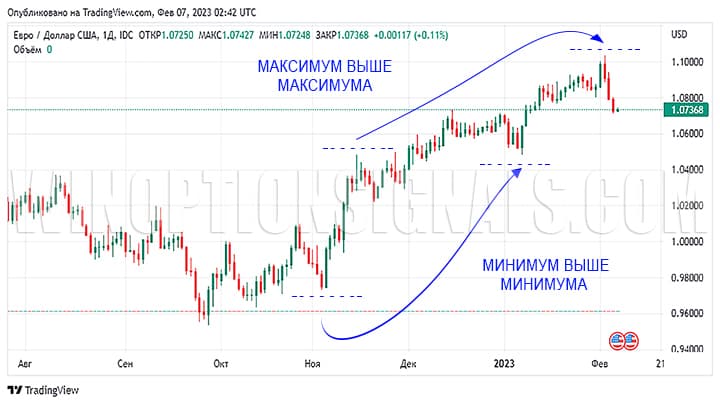
A trend is, according to the general definition, a stable movement of prices in one direction. According to the Dow Theory, the market always moves in waves. That is, prices can go beyond the trend, but they always come back. The theory describes that an uptrend requires the formation of higher highs and lows, and a downtrend requires the formation of lower highs and lows. Below on the chart you can see an example of an uptrend:
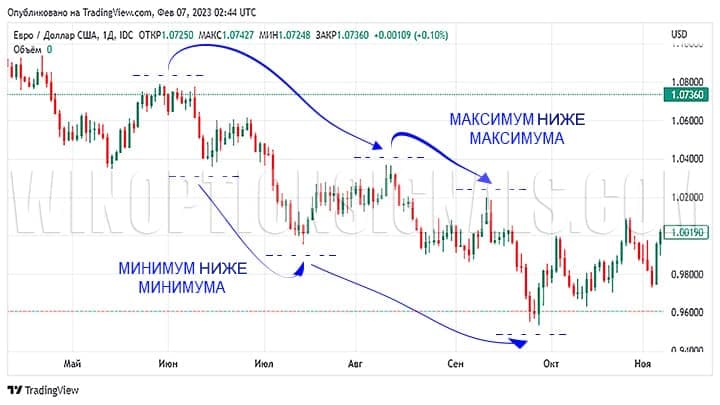
The following image shows a downtrend:
The Dow Theory describes 3 types of trends:
- main, which lasts more than one year;
- minor, lasting from three weeks to three months;
- minor, which ends within three weeks.
Each trend helps traders make long-term and other forecasts. Thanks to this, the Dow theory in binary options is highly effective.
Main trend
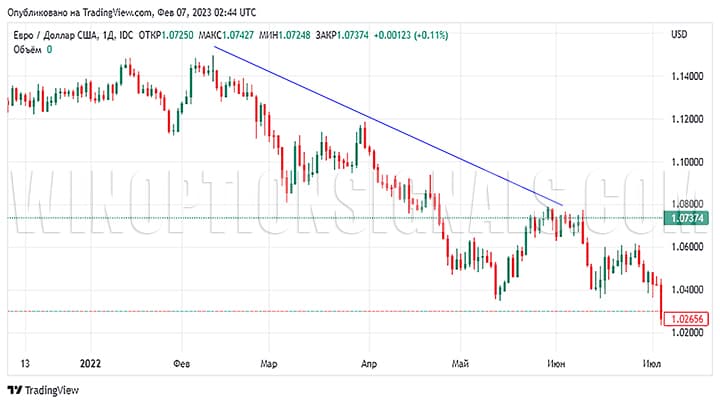
This type of trend reflects price movement in one direction (during this period, as follows from the theory, certain corrections are possible) for a year or more. To track it, charts with a time frame from one week to a month are used. Identifying this type of trend is quite simple. To do this, you need to draw a line on the chart along the minimums or maximums.
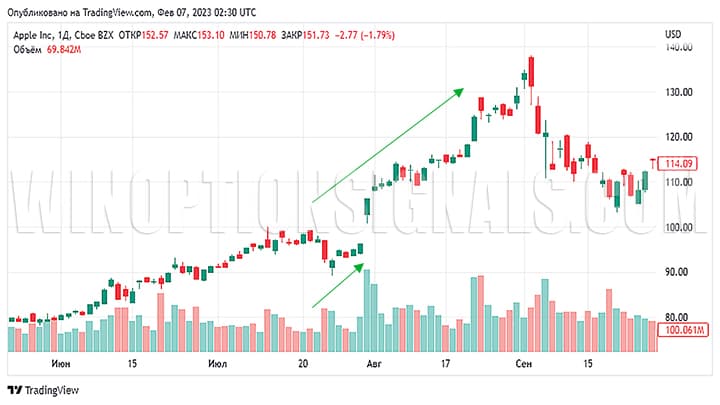
The image below shows the downtrend for the EUR/USD pair. This price movement will continue until events occur that will lead to higher prices. In this case, the new highs and lows on the chart will be higher than the previous ones.
Minor trend
A secondary trend may differ in direction from the main one. That is, the main trend can be directed downward, and the secondary trend upward:
According to the Dow Theory, when making forecasts in binary options, it is important to take into account that such pullbacks often constitute a significant part. That is, the secondary trend can deviate from the direction of the main one in 30-60% of cases.
Minor trend
The Dow Theory in binary options, as with standard assets, limits the duration of a minor trend to three weeks. In this case, price fluctuations that go opposite to the main direction are also possible. However, this appears in relation to the secondary trend:
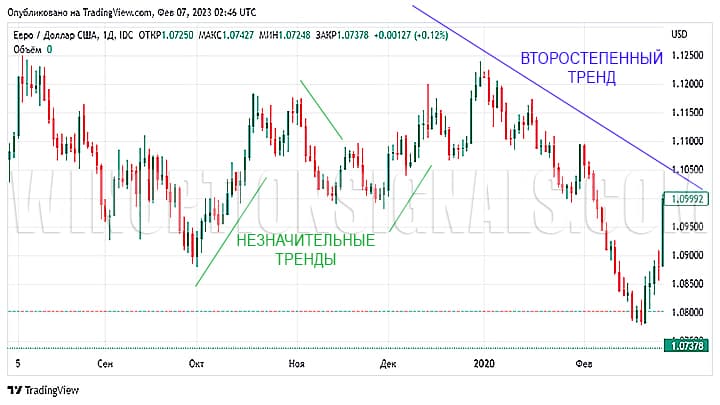
A minor trend is characterized by maximum volatility in comparison with the main and secondary ones.
Application of Dow theory in binary options trading
Even though binary options trading is done primarily on short time frames and the Dow Tritrend theory uses longer time frames, it can still be applied to trading digital contracts. However, it is worth understanding that using this theory in binary options will not allow you to quickly make a profit, since transactions will be carried out rarely. Therefore, the principles described are more suitable for long-term trading.
Also, using theory, you can determine the trend and use it in binary options. To do this, it is recommended to analyze the market according to three trends:
- the main one is to set a monthly timeframe;
- secondary - daytime;
- minor - sentry.
When trading binary options intrahourly, charts are configured differently:
- the main trend is revealed on a timeframe of 1 day;
- minor - 1 hour;
- minor - 5-15 minutes.
Using the principles described, you can constantly determine the current direction of price movement and make approximate forecasts about which direction the trend may turn over a given time interval.
Three phases of a trend
Each trend, according to the theory under consideration, goes through 3 phases:
- accumulation;
- participation;
- implementation.
Each of the above phases is easily identified on the graph.
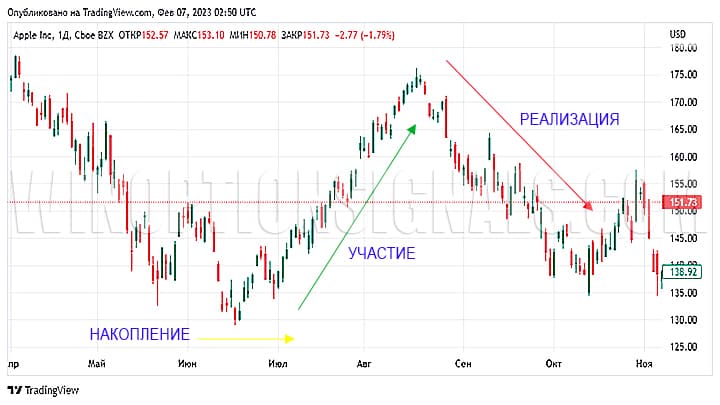
This Dow theory in binary options works on any market, be it stocks, bonds, currency pairs, cryptocurrencies, indices, and so on. Therefore, traders can use it when trading with any binary options broker .
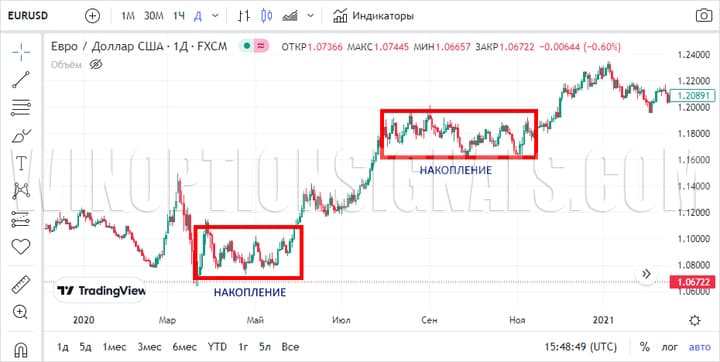
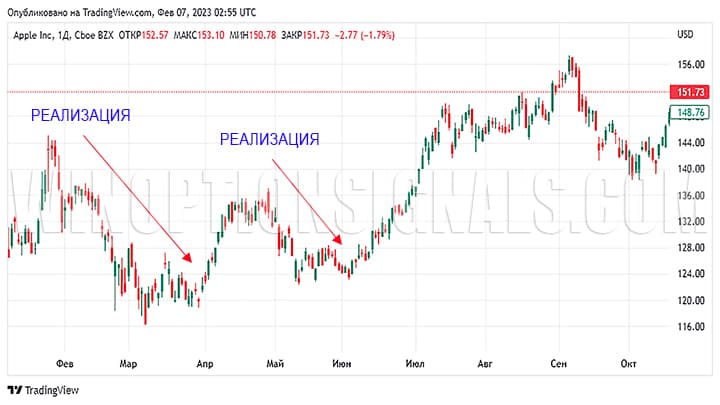
Accumulation phase
The first phase of the trend provides for the following conditions:
- the market reacted to all negative news that could affect prices;
- the upward trend has not yet formed.
On the chart, this phase looks like a sideways movement (flat) without sharp fluctuations. This phase allows you to purchase assets at the lowest possible price in a single time interval. As soon as there is an active influx of capital into the market, this leads to gradual “saturation”. That is, the second phase of the market begins, during which the price rises and the previous maximum is updated. The longer the accumulation phase lasts, the more pronounced and persistent the trend will be:
Participation phase
This phase is considered the longest, as it occurs when the price gains sufficient strength for a long upward movement. At this stage, the market is filled with both large (experienced) and small investors, including individuals. Such an active influx of traders is due to the fact that they see a stable upward trend and, fearing to miss a good movement, enter the market.
The advantage of this phase is that trading signals in such situations are reliable. During this period, the price only moves up, so it is easier for traders to predict changes in the market:
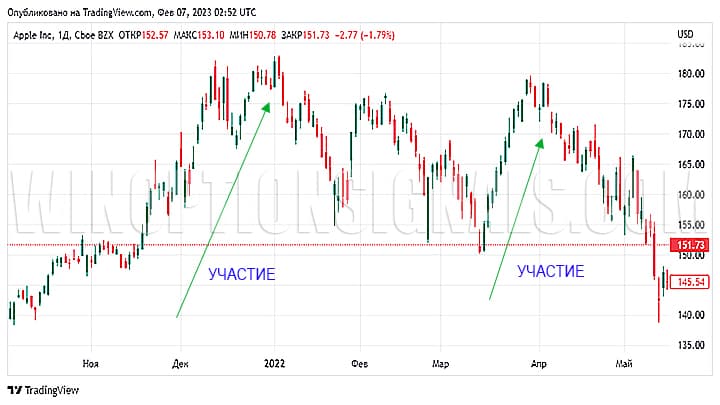
Towards the end of the accumulation phase, the behavior of market participants changes:
- large investors leave the market before this phase ends, since they bought the asset at the very beginning and have already received sufficient profit;
- smaller investors continue trading after the departure of large ones, but also gradually leave the market due to fear that the trend will soon end;
- small investors (“latecomers”) continue to be in the market and make new transactions.
Due to the departure of large investors who withdraw large sums from the market, the price of the asset falls at a certain point. But this does not always lead to a change in trend and small investors continue to trade with the trend:
Despite the departure of large investors, the remaining traders, working in the direction of the price, contribute to its growth. This is displayed on the chart as another breakout of the high. During this period, the upward trend attracts new participants. This encourages the movement to continue in the same direction.
The danger of this stage of the second phase is that the trend can turn in the opposite direction at any moment. To maintain the current trend, the media often publish analytical reviews or expert opinions that declare “incredible price increases.” This also attracts new investors to the market. But usually such publications appear at the end of a trend’s life. As a result, the influx of money stops (or its volume is not enough), which entails a stop and, sometimes, a reversal of the trend.
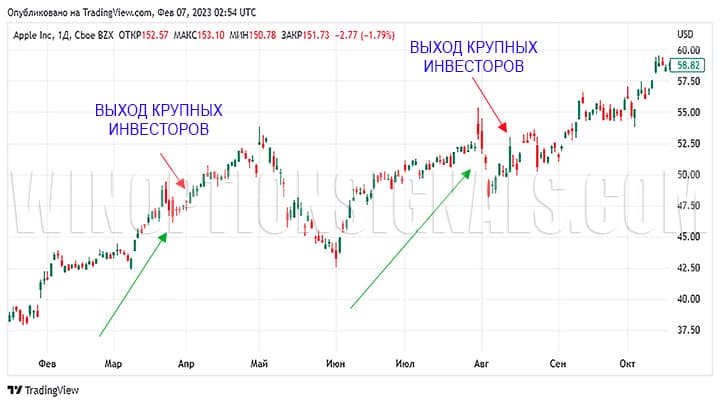
Implementation phase
At this phase, the bulk of investors leave the market (sell the asset). The reason is that many traders see the beginning of a trend reversal. In this situation, there is a fear of losing money, so investors sell assets:
When applying the Dow Theory in binary options, you need to remember the following rule: the stronger the participation phase, the more active the implementation phase will be. However, this period of a trend’s life does not always indicate panic.
There are always a lot of optimists in the market who believe that the price can stop falling at any moment and begin to rise. Because of such traders, a downtrend often becomes an uptrend for a while. However, this situation does not last long, since during this period negative news regarding the asset being traded increasingly appears. Therefore, traders continue to sell off, which pushes the price down.
The downward trend in the implementation phase will last until the market stabilizes. Such situations often arise against the background of the release of positive news. This encourages investors to return to the market. As a result, the accumulation phase is formed again.
Final Tips for Trading Binary Options Using Dow Theory
Next, we will look at some important factors that will help you improve binary options trading using Dow Theory. It is worth paying attention to:
- Indices and their correlation.
- Trading volumes.
- Trend reversal.
- Technical analysis.
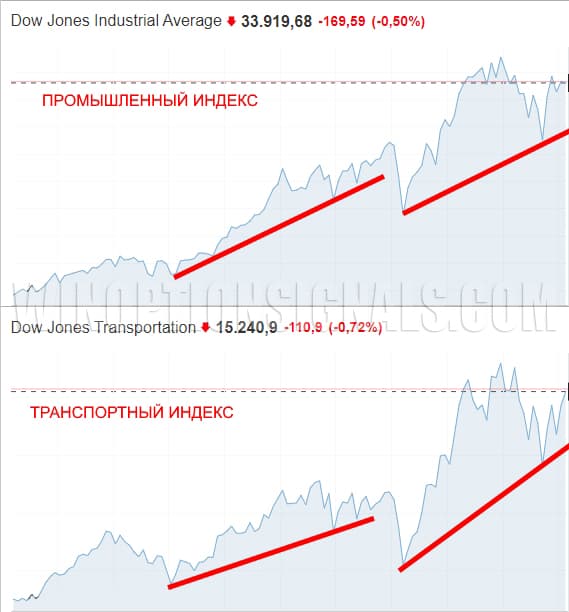
Dow Theory: Indices should confirm each other
The Dow Theory provides the following: market indices must confirm each other (that is, there must be a correlation between them). In this case, the price of one asset depends on the value of another. Within the framework of the theory, 2 indices are used: industrial and transport. They are based on the average price of certain companies. Within the framework of Dow theory, 2 situations are considered:
- both indices are moving in the same direction - there is a pronounced trend in the market;
- indices move in different directions - there is no clear trend in the market due to disagreements.
The trend is confirmed by trading volumes
The direction of price movement is often determined by the amount of funds that investors invest. This also comes directly from the Dow Theory, which states:
- as the price rises, the volume of investments increases;
- the price moves against the trend - investment volumes decrease.
The above principles allow you to find moments for a reversal, or sale of assets. This is indicated by the situation when, for example, after a continuing trend growth, volumes decrease. However, this aspect of Dow Theory cannot be applied to binary options based on currency pairs. The above rules do not work in this case, since tick volumes are not used there, but tick ones.
Another fundamental rule of trading, which applies to trading any assets or digital contracts: you cannot act against the trend. While there is a pronounced upward price movement, you need to buy Call options, and if it decreases, you need to buy Put options.
While there is no clear signal about the end of the trend, entering into transactions against it, hoping for a correction, rebound, or something else, is a loss of money.
Trend reversal in Dow theory and binary options
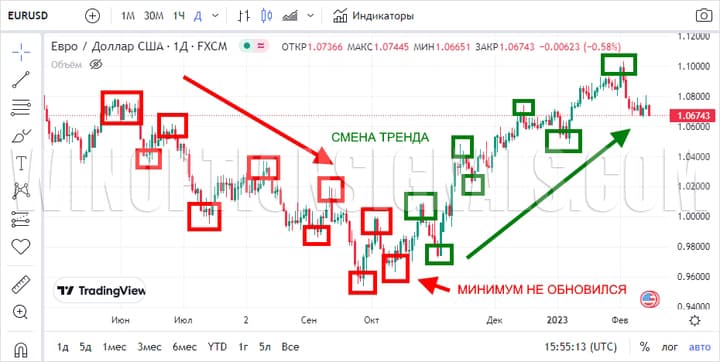
The moments of trend end and reversal are clearly visible on the charts. You can find them if you pay attention to the highs and lows. If the trend was downward and the extreme points were decreasing, and then after a flat or a sharp jump in prices the situation changed and the extreme points began to rise, then this indicates a change in the trend to an upward one:
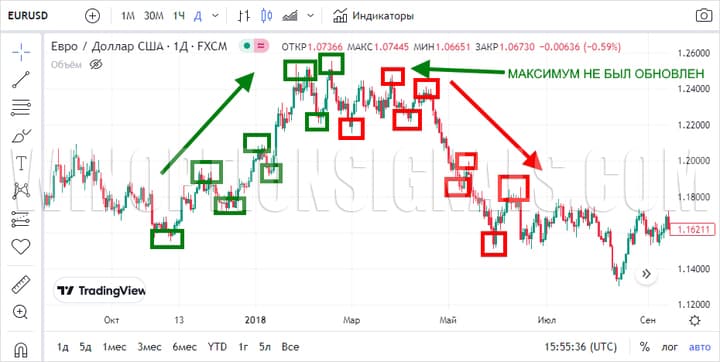
It is also easy to determine on the chart the moment when an uptrend turns into a downtrend. In this case, the maximums stop updating:
Technical Analysis and Dow Theory: Summary
The Dow Theory is the basis of technical analysis, used today by almost all traders in trading any asset. Based on this, many indicators and tools have been created that allow you to find moments to enter and exit the market. Therefore, the application of the Dow theory in binary options is a mandatory requirement for successful trading.

See also:
- The best binary options broker! Who is he?
- How to trade on weekends. What are OTC quotes?
- Live chart for binary options online
- Binary options trading platforms
To leave a comment, you must register or log in to your account.