There are many methods for using correlation dependencies when trading binary options on currency pairs, and the same number of indicators with which you can track correlations.
In order not to calculate the correlations of each asset separately, you can use indicators that make the work much easier. There are many such indicators, but we will consider the most convenient and useful of them.
Content:
- What is correlation ?
- Indicators for measuring the correlation of currency pairs .
- Overlay Chart correlation indicator .
- Correl 8B correlation indicator .
- Correlation indicator iCorrelation Table .
- How to trade binary options using currency pair correlation ?
- Conclusion .
What is correlation?
Correlation itself implies the existence of a relationship between two financial instruments. This means that a change in the price of one of the correlating currency pairs will entail changes in the prices of the second. The nature of such changes depends on the degree and type of correlation.
The pairs USD/JPY (white and orange candles) and EUR/JPY (orange line) are suitable as an example:
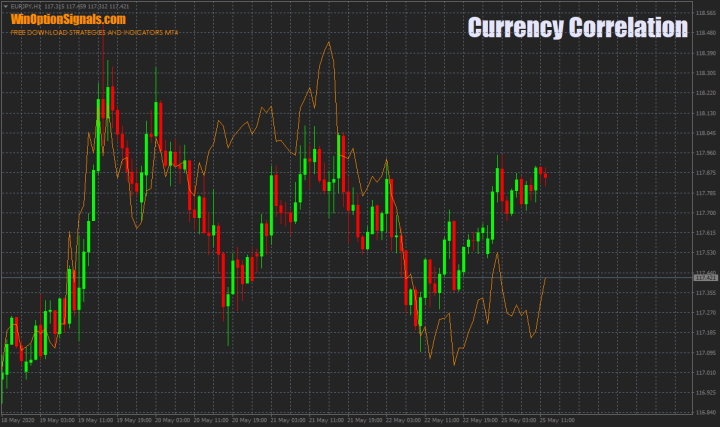
As you can see, both instruments are united by the presence of the Japanese yen. Since it is in the denominator, there will be a direct correlation between these pairs. If the yen rises, both pairs will begin to fall. But the degree of correlation of these instruments will not be absolute, because both the dollar and the euro are subject to different pricing factors. This means that we will not observe a complete coincidence of the graphs .
If we consider pairs such as EUR/USD (orange line) and USD/CHF (white and orange candles), we will find the presence of an inverse correlation, that is, when an uptrend in the dollar develops, the first pair will fall, and the second will rise:
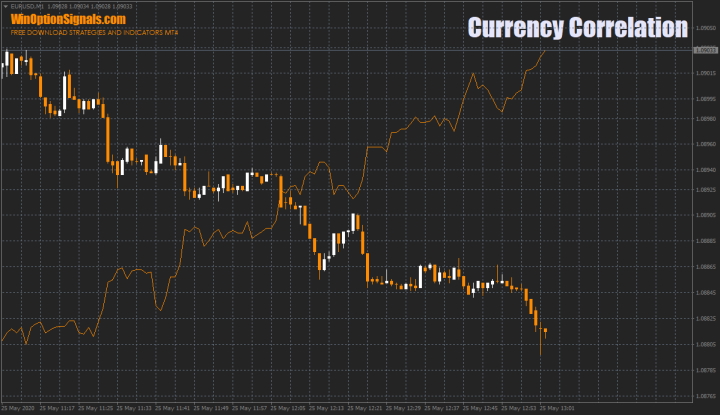
This is explained by the fact that in one case the dollar is in the denominator, and in the other - in the numerator.
As you can see, the price behavior of EUR/JPY and USD/JPY is quite similar, while EUR/USD and USD/CHF move in opposite directions.
Such information can be used to obtain more objective data on the movement of a particular currency. If we consider only the EUR/USD pair, we will not be able to accurately determine whether the USD is becoming more expensive or the EUR is becoming cheaper. But by supplementing it with other related pairs, such as EUR/JPY and USD/JPY, it will be possible, by comparing the euro and dollar with the yen, to determine the real direction of currency movements. That is, in the example shown in the screenshot we will see that:
- USD is rising against EUR and JPY.
- EUR is rising against JPY and falling against USD.
- JPY is falling against both currencies and looks weaker against the USD than against the EUR.
Indicators for measuring the correlation of currency pairs
Correlation indicators make this type of analysis more accessible to every trader, but they differ from each other in appearance and set of functions. Therefore, we will consider each indicator separately to make it clearer how to use them correctly.
Correlation indicator Overlay Chart
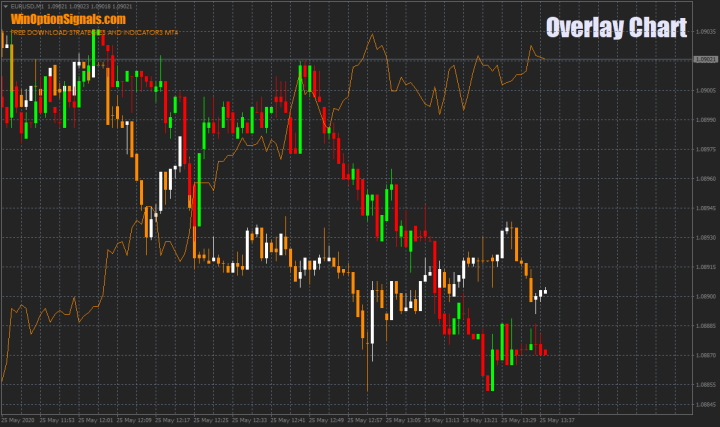
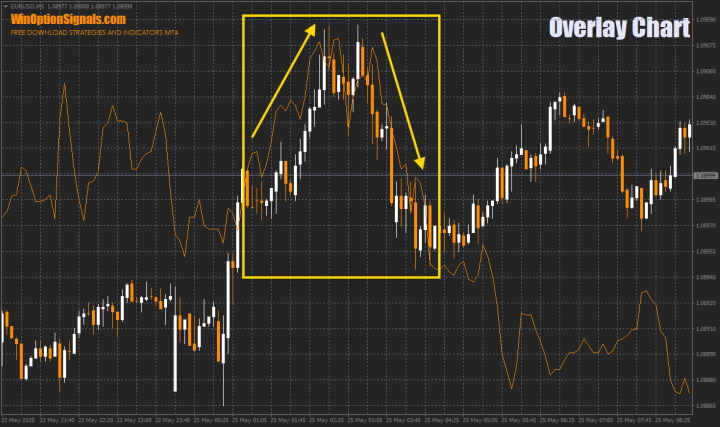
The most convenient indicator is the Overlay Chart, as it contains a minimum of parameters:
The indicator has only the necessary settings:
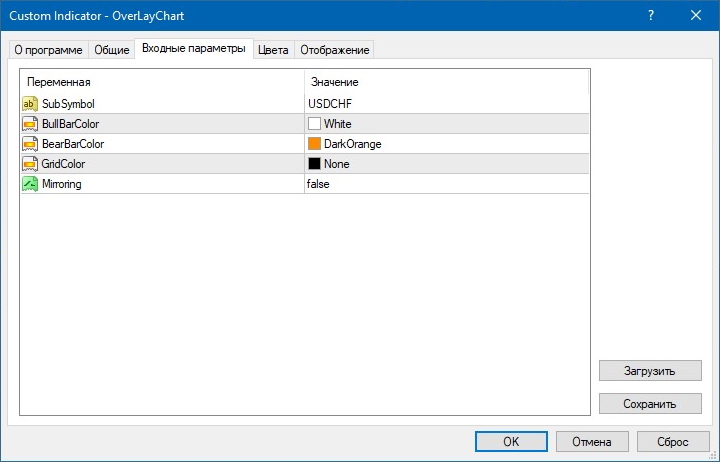
As a result, you can select the asset itself (a currency pair or any other instrument), adjust the colors of the candles, the color of the price grid, and, if necessary, set the “Mirroring” parameter (mirror mode).
You can fit any number of currency pairs in one chart, but more than three assets become inconvenient to track as they overlap each other.
Download the Overlay Chart indicator
Correl 8B correlation indicator
If you need to monitor a large number of currency pairs, then a more suitable option would be the Correl 8B correlation indicator:
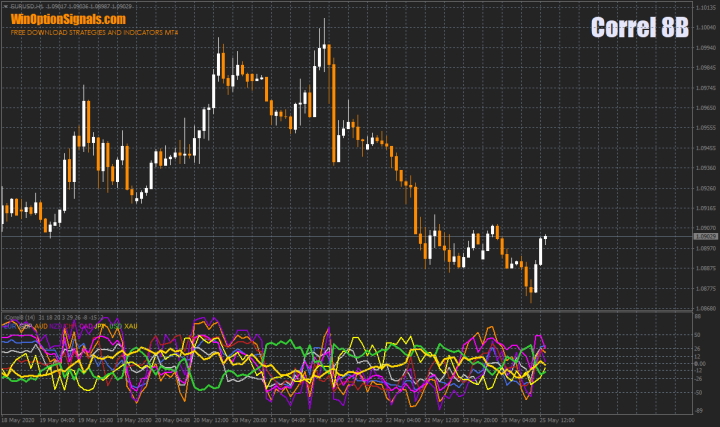
The difference between the indicator is that the correlation is calculated based on the underlying asset, and not on the currency pair, but essentially this does not change anything. But the disadvantages include the fact that you can analyze the correlation with this indicator only with those tools that are in the settings. These include all major currencies and gold:
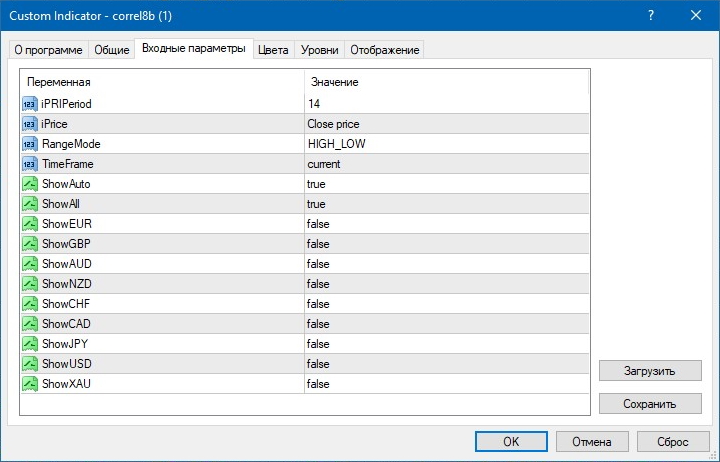
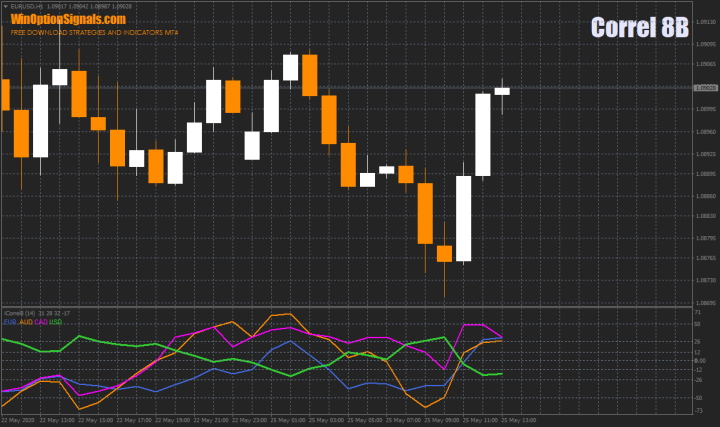
In the settings, you can also set the time period for calculating the correlation, select the price type and time frame. It is also not necessary that all currencies be shown on the chart; you can select only those that are needed for analysis:
Download the Correl 8B indicator
Correlation indicator iCorrelation Table
The iCorrelation Table indicator is the most informative of all correlation indicators, as it contains a table of currency pairs and a mini chart that allow you to use all the broker’s trading assets:
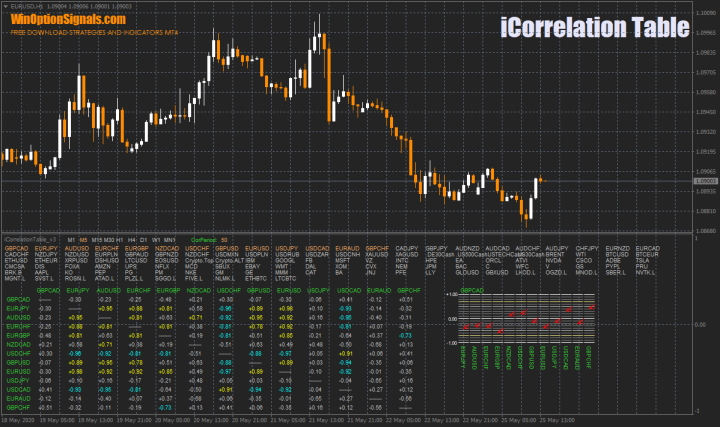
The indicator settings make it possible to change the visual component and adjust some parameters, but the main advantage of the indicator is that you can add new currency pairs for statistics on the indicator panel by selecting and dragging the desired symbol to the left. You can remove an extra symbol by selecting it and dragging it to the right. You can change the time frame in the same way.
If we talk about the indicators themselves, then determining the correlation between assets is very simple. The range varies from "-1" to "1". Accordingly, the higher the values of overlapping assets, the more strongly they correlate with each other.
In the picture below you can see the overlapping assets, and the AUD/USD and EUR/JPY pair have almost the maximum correlation level, which is 0.95. On the contrary, the USD/CHF and NZD/CAD pairs are weakly correlated with each other and have a correlation level of -0.49:

In the same way, you can analyze other currency pairs or assets that are available from the broker you are using.
Download the iCorrelation Table indicator
How to trade binary options using currency pair correlation?
Correlation trading does not guarantee ideal accuracy, and therefore this type of trading should be used with long expirations, starting from 5 candles and above. The most important thing that will need to be seen when analyzing currency pairs is their maximum correlation. And when such a section is found, you can try to buy a Call or Put option, depending on the currency pair and movement.
For example, you can consider a section with the currency pairs EUR/USD and USD/JPY, which quite rarely correlate with each other, but they also have sections with correlation:
Once such a site has been found, you can try to buy options. As you can see, an expiration of 5 candles could bring potential profit. Please note that the correlation in this case was almost 100%, which is an important factor in making trades.
Conclusion
The degree of correlation of financial instruments may vary. Somewhere there will be a very pronounced relationship, and somewhere there will be none at all. Moreover, this degree may change over time due to changing economic and political factors. For a more visual and rapid assessment of such relationships, there are correlation tables . The values in them range from “1” to “-1”, where “1” indicates the presence of absolute direct correlation, and “-1” inverse.
Many currencies, stocks, futures and indices have similar relationships. For example, oil prices are measured in dollars, and therefore its increase will lead to a decrease in oil prices. This fall, in turn, will lead to a decline in the Canadian dollar, as oil exports take up a large share of Canada's economy.
For this reason, before you start opening positions, you should not only study the indicators on different timeframes, but also the presence of correlations with other assets, as well as the nature of these connections. This approach allows you to get a more complete picture of what is happening in the instrument chosen for options trading, and will also protect you from many erroneous transactions.
Can't figure out how this strategy or indicator works? Write about it in the comments to this article, and also subscribe to our YouTube channel WinOptionSignals , where we will definitely answer all your questions in the video.
See also:
News about binary options


To leave a comment, you must register or log in to your account.