
Japanese candlestick method
 In the early eighteenth century, Japan used the "candle method" to predict the price of the rice crop. The system was developed by a family of rice traders. Over time, the author took the place of advisor to the emperor, and left a wonderful system of profitable trading for his descendants. A little later, the concept was abolished. We remembered the method of analyzing the stock and currency markets and found a new application for it. About forty years ago, the Japanese candlestick method was considered a technical analysis method. It is similar to a bar chart, but much easier to understand. This is probably the most romantic method of technical forecasting that exists. Externally, the chart resembles candles laid out in a row on a flat surface. They come in different sizes and can be with or without a wick.
To build a chart, you need to have four types of prices: opening, closing, high and low. In a situation where the opening price is at a higher level than the closing price, the trend will be downward, and the color of the candlestick will be black or red. Sometimes it is called bearish, because the top remained with the sellers, i.e., the bears. In the opposite situation, the candle will be white or green, since the buyers or bulls have the upper hand. The body of the candle, its wide part, is called “jittai”, shows the difference in price between the opening and closing of the trading session. Thin lines adjoin the body of the candle. This line is called a “shadow”. Shadows show the maximum and minimum price levels in a given time period. The line under the body is the lower shadow. The upper shadow is located above the body. They reflect the minimum and maximum prices respectively.
There are three principles for analyzing Japanese candlesticks.
- Body strength. It is based on an analysis of the length of the candle body. The length is directly proportional to the market’s desire to move up with a white candle, and down with a black candle.
- The power of the shadow. Here, the main criterion for analysis is also length. The higher the indicator, the stronger the market’s desire to move in this direction, however, the desire is not supported by opportunities and is unviable. If the upper shadow reaches a large length, this means that the opportunities for those playing for a rise are very small and there is no opportunity to consolidate the victory of the bulls over the bears. A long lower shadow indicates the opposite situation.
- The power of denial. If the market does not move in the direction predicted by the first two points, then it will definitely move in the opposite direction. This is one of the most effective methods of forecasting.
Using combinations of the principles described above, you can see patterns of market movement. Candles are the psychology of the market; they reflect the desires, moods and fears of traders.
A big advantage of candlestick analysis is the ability to use the method with other sets of analytical tools. It is available for use by beginners and professionals. The effectiveness of the method has been proven by many traders over a sufficient period of time.

We offer you a choice of three Japanese candlestick indicators from different authors:
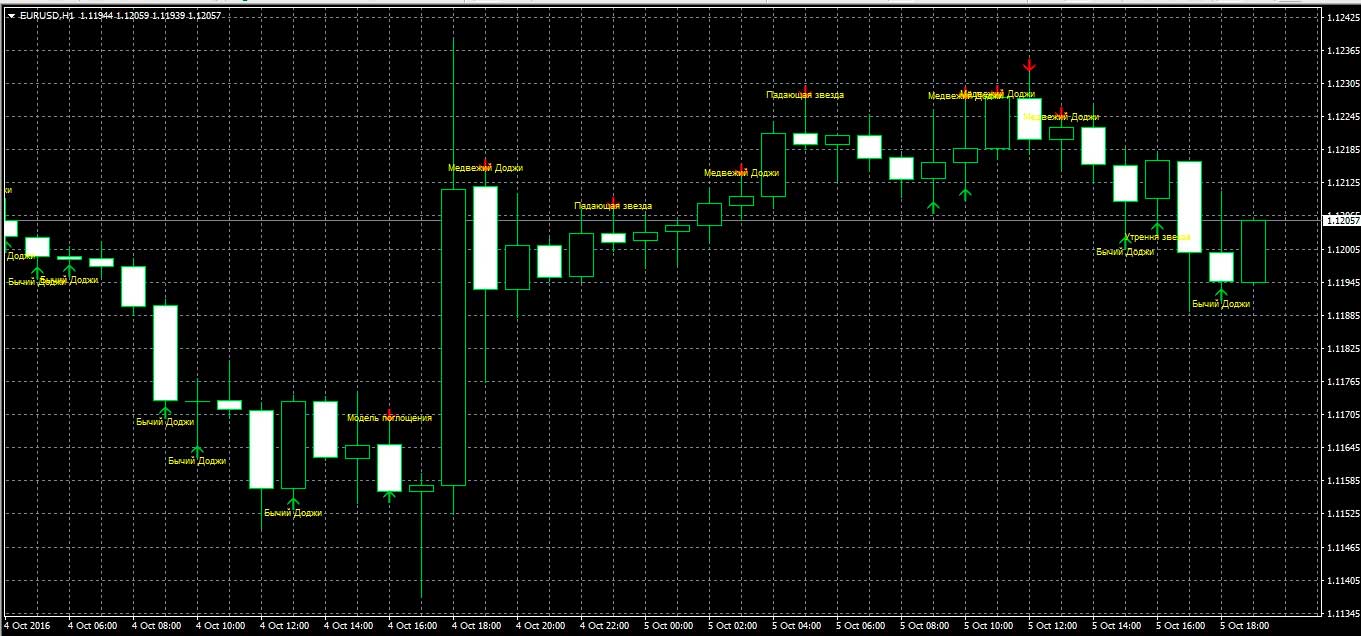
CPI indicator "CandleStick Pattern Indicator" (Steve Nison's Legacy)
This indicator will allow you to recognize all the main patterns of Japanese candlesticks. When a pattern is detected, the indicator produces an audio message.
List of Japanese candlestick combinations that the indicator can recognize:
|
|
A description of these models is in the PDF manual, which comes in the archive with the indicator. CPI is able to work on any currency pair, metals and stocks. All timeframes are supported.
Description of CPI (CandleStick Pattern Indicator) indicator settings:
- Show strong reversal patterns - on/off showing strong reversal patterns
- Show weak reversal patterns — on/off showing weak reversal patterns
- Show continuation patterns - on/off showing trend continuation patterns
- Show Unclassified - on/off showing additional patterns
- View Bars - how many last candles to take into account
- Sound Alert - turn on/off a sound signal when a candlestick pattern appears
- Sell Color - down arrow color for bearish signals
- Buy Color - up arrow color for bullish signals
- Text Color — text color on the chart
You can download the CPI indicator "CandleStick Pattern Indicator" (Steve Nison's Legacy) here .
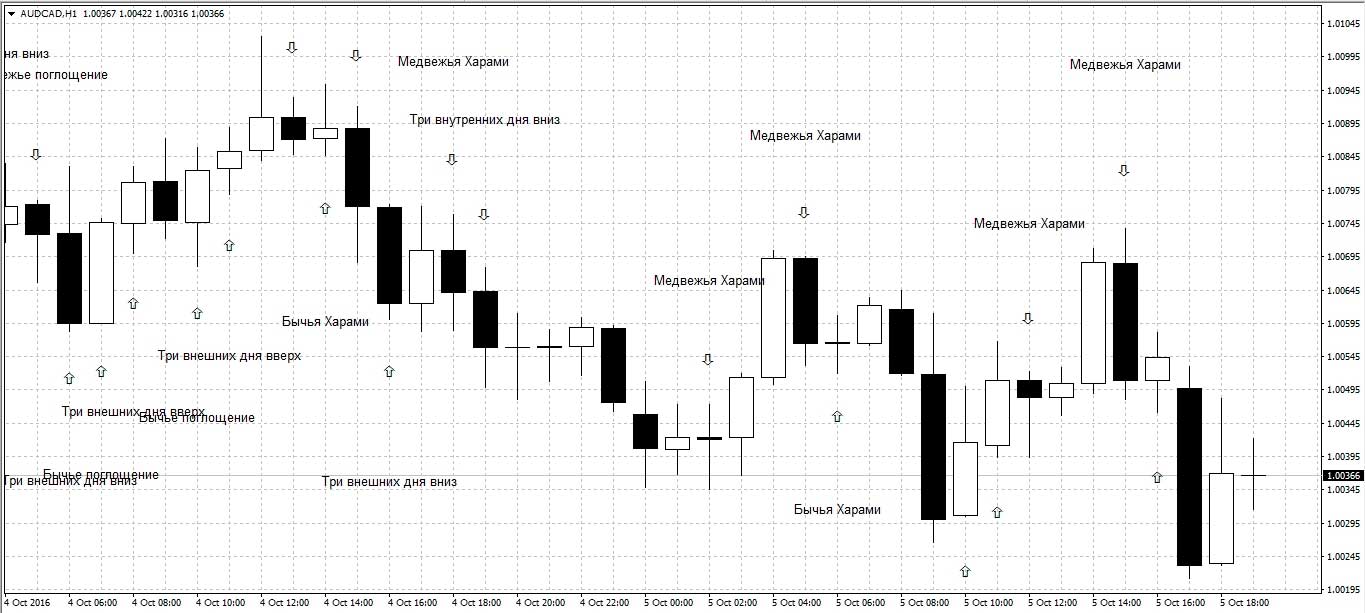
Japanese candlestick indicator
This indicator shows significantly fewer combinations and is better visible on the white color scheme of the MT4 terminal.
You can download the Japanese candlesticks indicator here
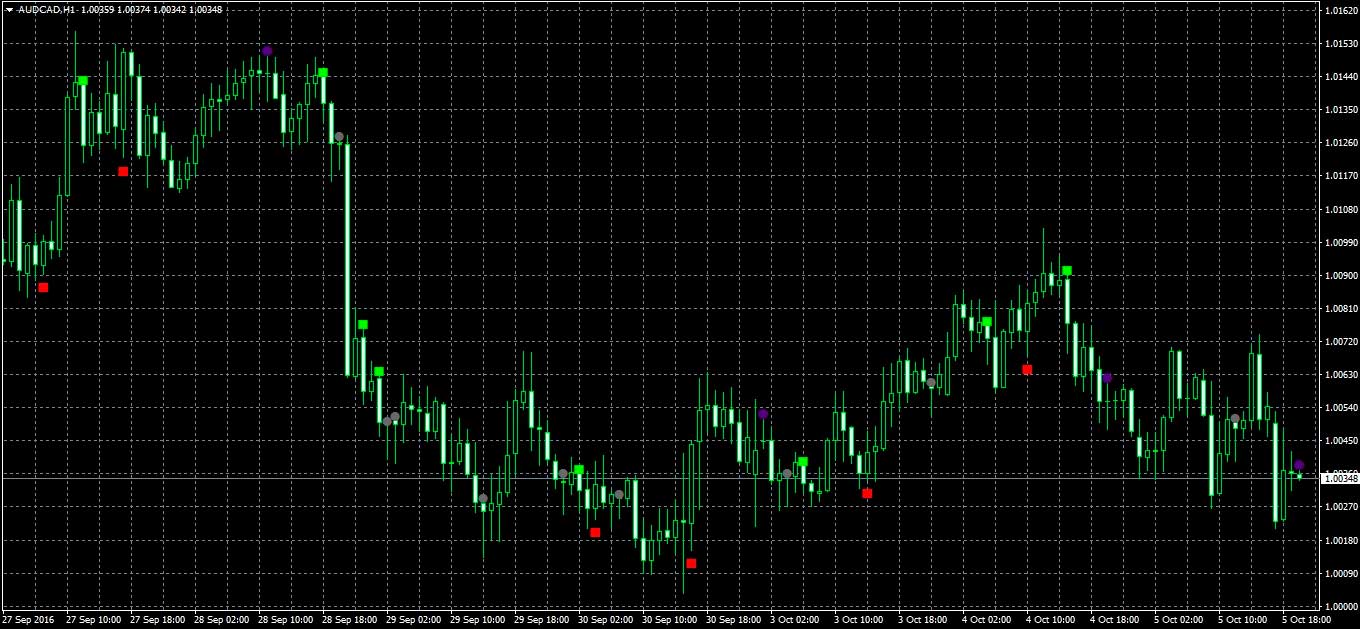
Japan indicator
This indicator also shows a small number of combinations of Japanese candlesticks, and displays the names only when you hover over the pointer, but is very popular and very reliable in use.
Download Japan indicator
When using any of these indicators, it is worth considering that it is not a ready-made strategy for trading and each signal must be accompanied by at least one more indicator or level.
|
How to install an indicator in MT4 |
Can't figure out how this strategy or indicator works? Write about it in the comments to this article, and also subscribe to our YouTube channel WinOptionSignals , where we will definitely answer all your questions in the video.

To leave a comment, you must register or log in to your account.