
Divergence cannot be called a highly accurate tool on the basis of which a decision is made to open a position, but it allows you to conduct technical analysis and get a general impression of the current situation on the market. Moreover, the wider the trader’s functionality, the better. Therefore, the ability to see divergence on a chart allows you to make much better forecasts. In addition, one of the features of binary options is their flexibility in relation to the choice of trading strategy using technical analysis tools.

Concept of divergence
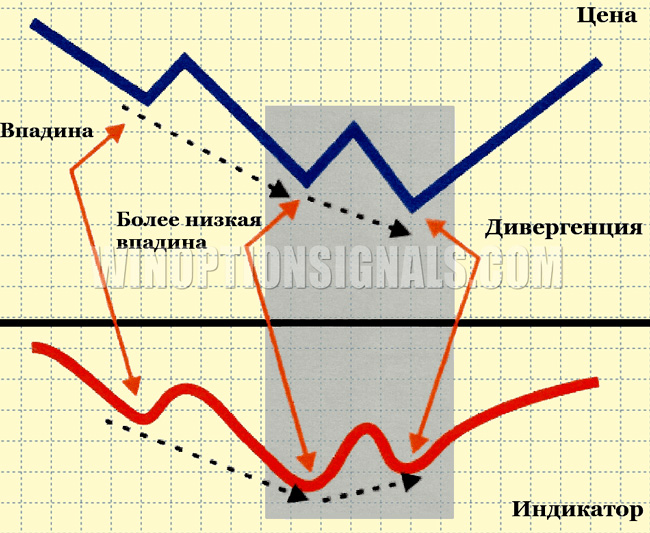
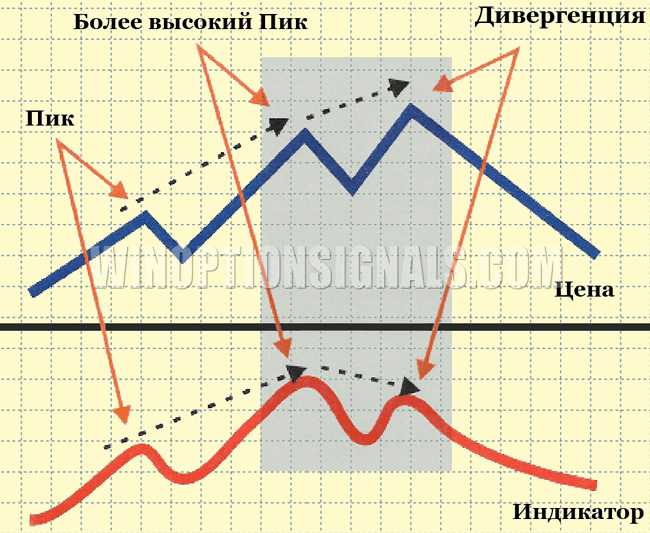
To put it simply, divergence is a discrepancy. In a specific case, this refers to the discrepancy between the readings of technical indicators and the price of an asset. Divergence indicates that the strength of the trend is weakening, which allows the trader to see a potential reversal in advance and make appropriate trading decisions based on this information. Since the trend can be bullish or bearish, divergence is called similarly. In each of these cases, the trader must find two extreme points that will coincide on the indicator and the price chart.
In a downtrend, a bullish divergence is likely to appear. In the terminal, this is displayed as follows: on the chart, two consecutive lows will decrease, and the indicator will show two consecutive lows that increase. This formation speaks of nothing more than the possible end of the downtrend.
In the case of bearish divergence, an upward trend is observed on the chart. The trader must find two consecutive increasing highs on the chart, and two decreasing highs on the indicator.
The more coinciding extrema, the stronger the signal. If there are three or more consecutive peaks/troughs, then this is already a rather important signal. When trading BO, it is necessary to choose the correct expiration time. You should not take too short a period of time to make a quick profit, since this approach is not always justified.
Divergence is a flexible tool. With its help, you can determine not only the reversal of a trend, but also its continuation. Therefore, the use of divergence is not limited to receiving signals of the same type. This tool is the basis of numerous diverse strategies.
Indicators used
It was already mentioned above that divergence can be determined using an indicator. The trader himself determines which one to use. Almost any instrument belonging to the category of oscillators or trend indicators is suitable for these purposes. The most commonly used are OsMA and MACD (for large time frames), as well as Stochastic and RSI (for small time frames). If you prefer short-term trading, then it is better to give preference to oscillators whose periods are not too long.

Any indicator works on the same principle. For example, when using MACD, extreme points that coincide with the chart will be visible on the histogram. If we see lows, then we are talking about bullish divergence.

The presence of divergence is also determined using RSI. However, it is worth remembering that different indicators can give different signals. To reduce risk, it is recommended to use several technical indicators at once. Based on the readings of several instruments, you can get an impression of the strength of the signal.
Examples of using divergence in binary options
It is very important to understand the principle of identifying divergence. Then the trader will be able to see it even without using additional markup. In the first couples, don’t be shy about applying markings. Regular trend lines are used to mark extreme points. Below we will present examples in which we will determine divergence based on Stochastic readings.

At the very beginning, you need to find extreme points on the indicator. This is somewhat more difficult to do in real time than in history. Here you need to adhere to one simple rule - you should take into account the indicator readings only after the candle closes. Only closed candles can be used to diagnose the presence of an extremum.

Therefore, you can make a decision to buy an option only after the last candle is closed and coinciding extremes are formed on the indicator and chart.

Important! You should choose the direction of the option not according to the direction of the indicator, but according to the direction of the price movement. The expiration time should not be less than the size of the figure.
Trading is carried out against the trend, so the price must be given time so that it has time to go in the opposite direction. This must be taken into account. In some cases, it is recommended to slightly increase the expiration time. This approach is especially relevant when market volatility is low.
Conclusion
The presence of divergence is not always a precursor to a trend change. However, this tool is very important in identifying turning points. You can take this into account and not enter the market against the signal. It is best to use divergence with other signals. It can become a good basis for a high-quality trading system.
Can't figure out how this strategy or indicator works? Write about it in the comments to this article, and also subscribe to our YouTube channel WinOptionCrypto , where we will definitely answer all your questions in the video.
To leave a comment, you must register or log in to your account.