
To become a good trader, you must constantly be in search of new information, with the help of which you can gain an advantage in your favor in the financial market. Every day more and more different indicators and trading systems based on them appear. A trader must be able to analyze global data and is constantly in testing mode for various trading instruments. Some of them can significantly improve trading efficiency. In this article we will talk about the OsMA (Moving Average of Oscillator) indicator. This oscillator can be called relatively new. With its help, a trader can get an idea of the market situation.

The emergence of OsMA
The name speaks for itself. The tool is a hybrid of an oscillator and a trend indicator. Thanks to this symbiosis, it becomes possible to trade in a situation in which there is no pronounced trend, and the chart represents a sideways price movement.
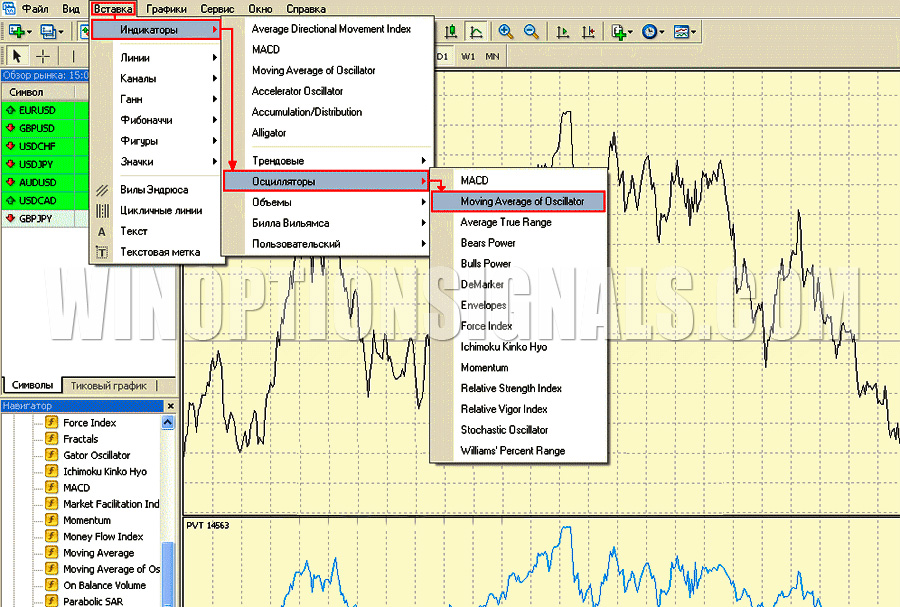
One of the main goals of the creators of OsMA was to rid the oscillator of the main drawback of MACD - the delay of signals. It was assumed that this approach would improve the accuracy of technical analysis. The experiment turned out to be very successful. Today, the OsMA indicator is the basic indicator in any modern trading terminal. For example, in MT4 it is located in the “Insert-Indicators-Oscillators” item. This eliminates the need for traders to search for this tool on the Internet. It will always be at hand.
Description of the OsMA indicator
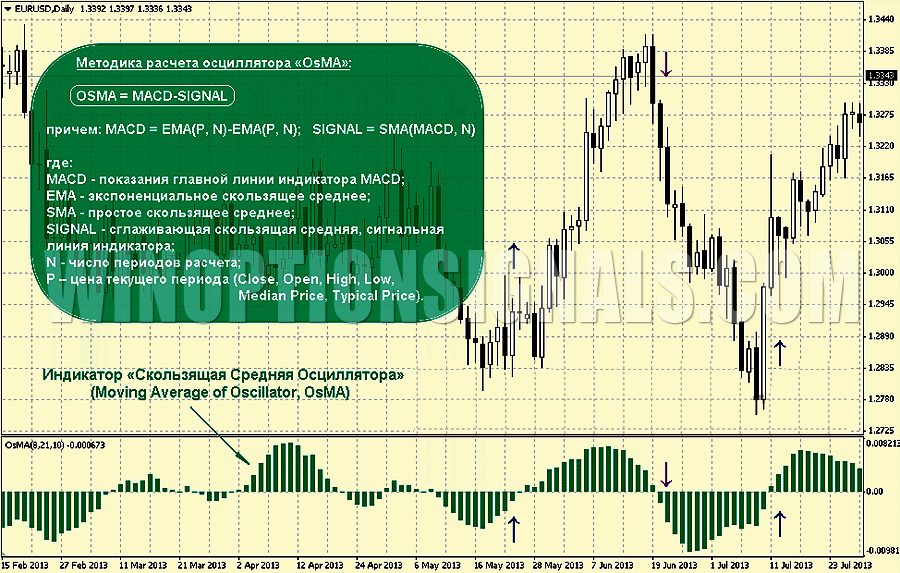
The indicator values show the difference between the signal line and the well-known MACD. Moreover, this line is not a standard MA, but something else. As a result of the calculations, the indicator draws the columns of the chart.
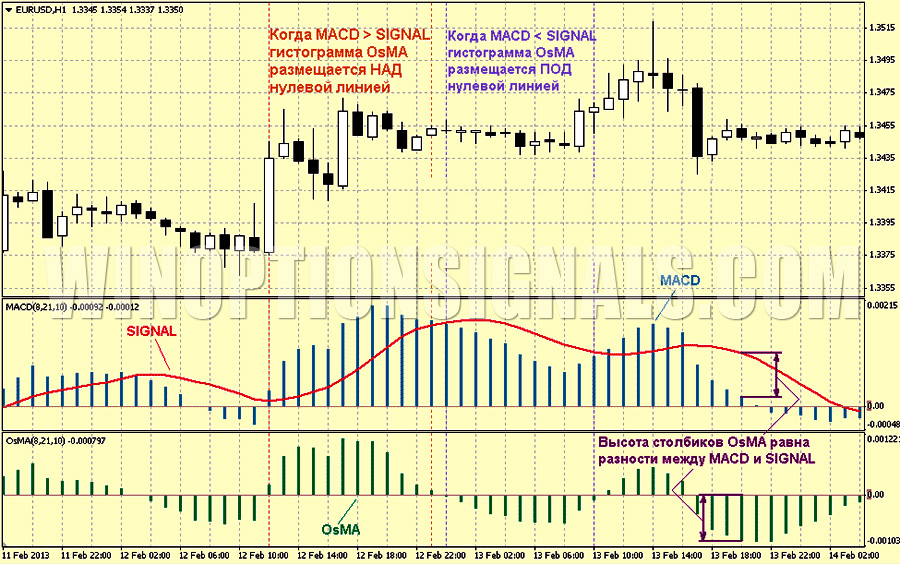
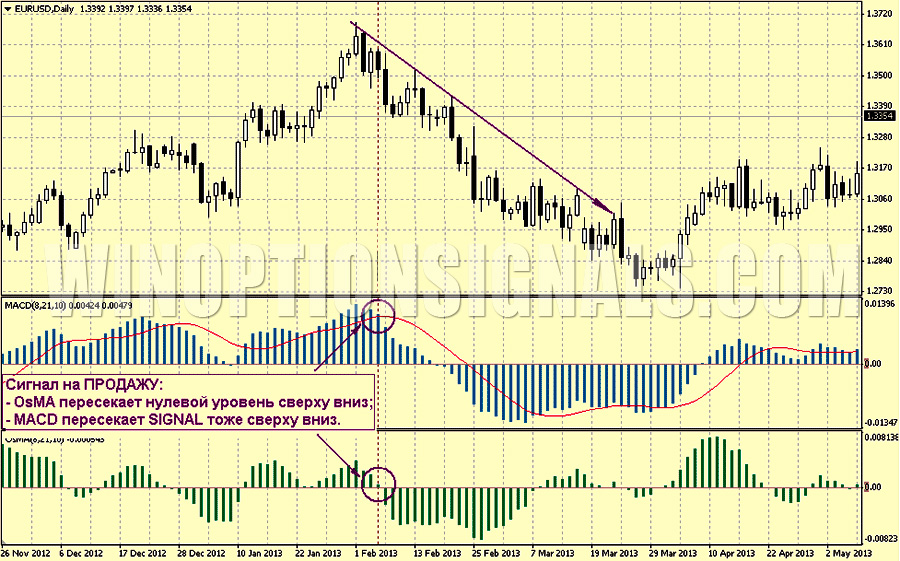
The situation when the MACD columns are located above the signal line will be similar to the situation in which the OsMA columns are above the zero level. If the MACD line passes above the bars, then the OsMA histogram will be below the zero level.
The size of the bars that form the histogram depends on the distance between the bars and the MACD signal line.
This information is also used for market analysis, since the height of the OsMA columns is an indicator of the strength of the existing trend.
OsMA parameters
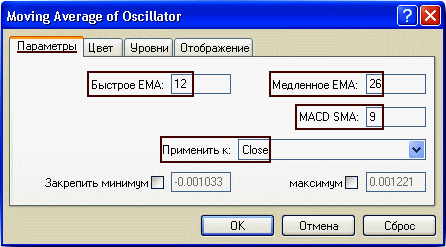
When adding this indicator to the chart, the terminal user can see a list of elements to be configured. They are all located in the “Options” tab. All of them are part of the indicator’s operating algorithm. There are four such elements in total. Every professional should know what he is working with.
- Allows you to change the number of candles based on which the exponential MA is calculated. This is necessary to determine the short-term trend.
- Allows you to set the period of a slower exponential MA. It shows the general trend.
- MACD SMA. Simple moving average parameter. It functions as a signal line.
- "Apply to". Here you set the prices that you need to focus on in the process of constructing the MA.
Trading using OsMA
Below we will consider one of the simplest strategies based on this indicator. First you need to understand that OsMA is a modified MACD. Therefore, the description of trading operations will be accompanied by a comparison of these two instruments.
Basic signals
- You need to buy when the OsMA histogram columns cross the zero line from bottom to top. It is also worth paying attention to the size of the columns. If they continue to rise, then this is a clear sign of a strengthening trend. It is advisable to close a position at the moment when the bars begin to decrease, as this indicates that the trend is fading.
- Sell transactions should be considered when the OsMA histogram columns cross the zero line from top to bottom. As in the previous case, you can hold a position until the size of the columns decreases. As soon as such a picture is observed in the indicator window, you can begin to look for an exit point.
Additional nuances of working with OsMA
Beginning traders should understand that the OsMA indicator, like many others, will inevitably periodically give false signals, which will be expressed in the premature completion of the trend, although the situation will give a clear idea that this is just a correction. For this reason, it is recommended to use additional technical analysis tools in conjunction with OsMA, for example, support/resistance levels. This will make it possible to make more informed conclusions about the advisability of entering and exiting the market.
Profitable trading is possible only with a comprehensive analysis. OsMA is only part of it. A trader should always objectively assess the situation and make informed decisions. Blindly following every signal can lead to losses.
With the help of OsMA, it indicates in time the emergence of a trend and allows you to enter the market at the stage of its formation. This is exactly what you need to use to get maximum profit on the transaction.
Divergence
For those who have dealt with MACD, the concept of divergence is quite familiar. Divergence is the discrepancy between the price of an asset and the readings of the oscillator. Using OsMA to detect divergence is very effective. As practice shows, most such signals are processed. To see this, consider several examples.
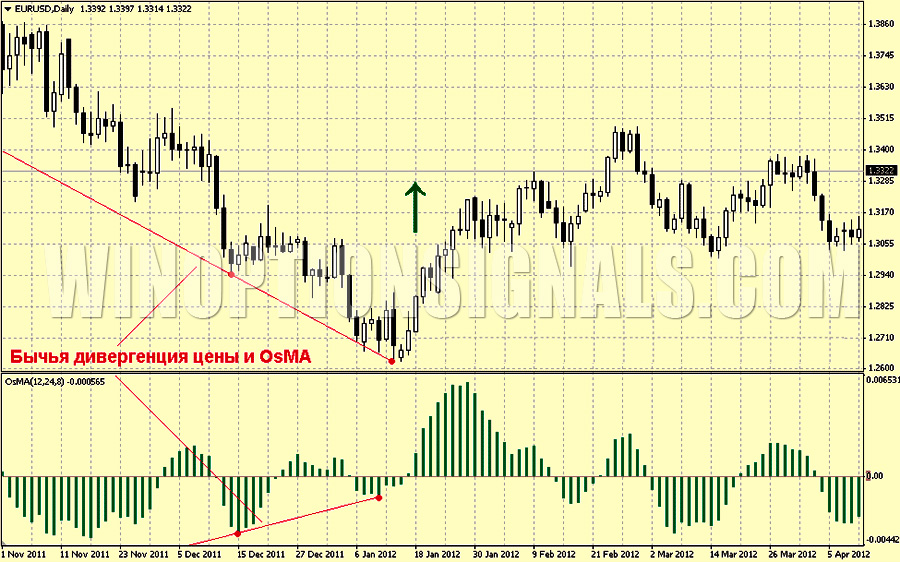
- Buy divergence. For example, a trader sees discrepancies between the candlestick chart and the formed extremes in the indicator window. Price movement makes it clear that there is a downward trend in the market. The histogram formed two increasing lows. Most likely, this is a sign of an imminent price reversal. In most cases, an open trade will bring a profit, and the trader has the opportunity to enter the market at the very beginning of the formation of a new trend.
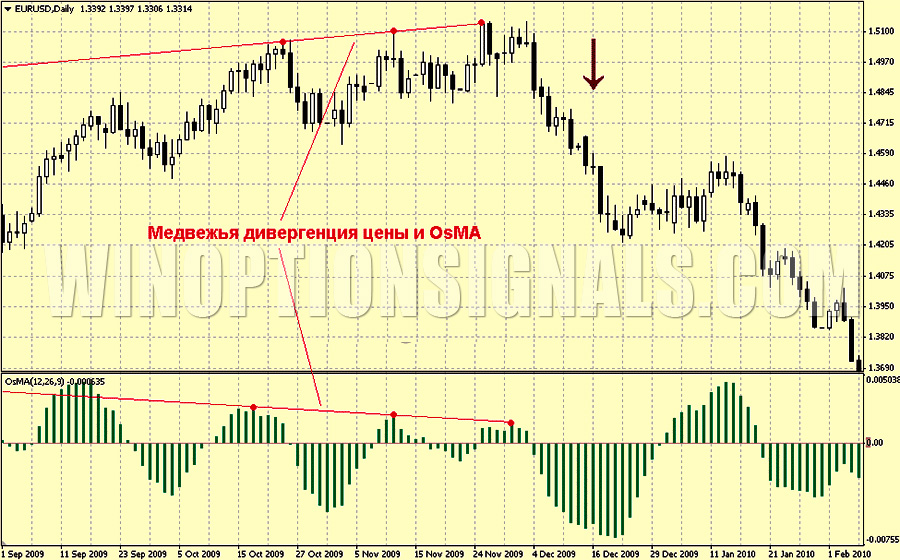
- Divergence for sale. The signal is generated in a similar way. During a bullish move, the candlestick chart shows several rising peaks. If the OsMA histogram shows decreasing highs, then it’s time to open a bearish position.
Advantages of OsMA
Thanks to the existence of OsMA, every trader has the opportunity to use an improved MACD in their trading, which is free of its shortcomings. Most signals received are timely and accurate. The trader can find the optimal entry point, since the indicator will allow one to determine a deep correction or an emerging trend. It makes no sense to say what advantages the absence of lag gives. OsMA gives serious advantages to the trader when performing trading operations on Forex.
But you should always remember that the financial market is a very complex structure. Therefore, you should take into account not only the advantages, but also the disadvantages. Other indicators should be used to confirm the signal. By the way, it is not at all necessary to choose between OsMA and MACD. Most experts say that they work well in pairs and complement each other.
Download the OsMA indicator with a divergence signal
Can't figure out how this strategy or indicator works? Write about it in the comments to this article, and also subscribe to our YouTube channel WinOptionCrypto , where we will definitely answer all your questions in the video.
To leave a comment, you must register or log in to your account.