 The standard RSI indicator is used in many trading strategies; this will not surprise anyone, because its effectiveness has already been proven. It is subject to various modifications; users independently optimize the indicator, increasing the accuracy of signals for binary options.
The authors of the guide “New Technical Trader” - investors with many years of experience - also decided to work on RSI in order to eliminate what they consider to be a significant drawback. Tushard Chand and Stanley Kroll did not like the fact that the instrument’s readings could fluctuate for a long period in the 20-80 channel without crossing its conventional boundaries.
The new development of Stochastic RSI is more sensitive, often demonstrating that prices are in oversold or overbought zones.
Features of the Stochastic RSI indicator
This software product is installed on the Metatrader4 platform. You can trade with it on any currency pairs, any time frame, without restrictions on the time of day.
It will be easy to download and install the indicator, following the instructions for working with proprietary products.
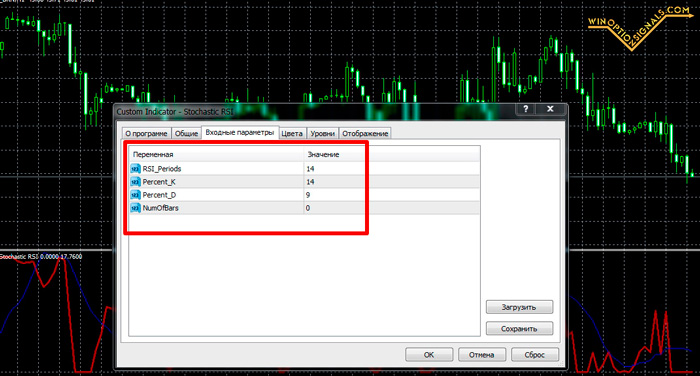
The development has only 4 settings:
- NumOfBars — number of bars taken from history for calculations;
- RSI_Periods — RSI period;
- Percent_K – %K stochastic parameter;
- Percent_D – %D stochastic parameter.

As we remember, the standard Stochastic has a “slow down” setting that helps filter out excess noise. In the “hybrid” we are considering, it is excluded as unimportant.
Stochastic RSI is a stochastic oscillator based on RSI readings, without taking into account the price itself.
When analyzing data, RSI compares the absolute value of the fall in quotes with the value of the increase over a specified time period. The result is shown on the graph - this is a curve with values from 0 to 100%. Stochastic compares the closing price of a candle with the high/low for a certain period. The new Stochastic RSI, accordingly, gives signals based on a comparison of the current RSI indicator with previous ones in a specified “section” of the chart.
The custom indicator is more flexible and sensitive to market changes, reflecting price jumps in a timely manner.
Instructions for installing indicators in MetaTrader 4:
Using the Stochastic RSI indicator
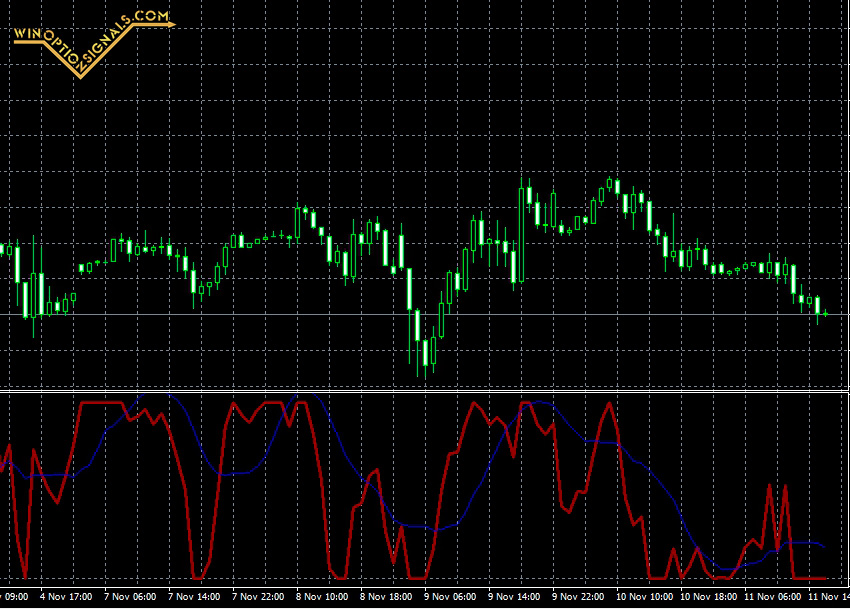
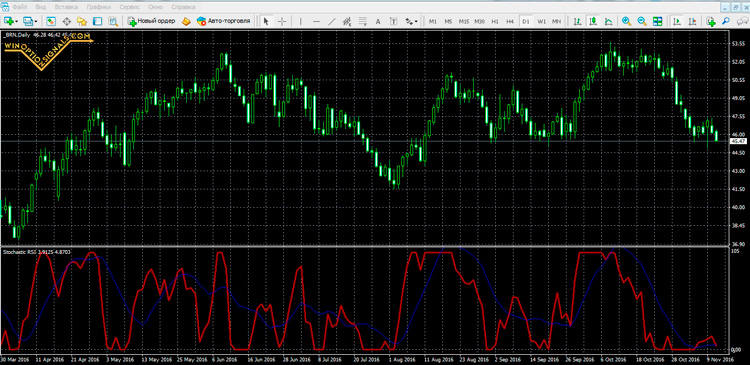
Stochastic RSI, as a combination of two oscillators, is itself one. It is similar to a regular stochastic, but without overbought/oversold zones. They were replaced by levels “0” and “100”.
At the moment when the RSI decreases to the next minimum, the indicator equals zero. When the maximum is “taken”, the Stochastic RSI will “jump” to one hundred.
Trading recommendations:
- We focus on the overbought and oversold zones, setting for this additional levels of the standard stochastic “20” and “80”. When they cross, we receive a sign that it is time to act. But keep in mind: increased sensitivity leads to increased false signals;
- An excellent filter is level “50”. When the price passes it, it is time to open a trade. The signal comes out reliable and timely. If the indicator is above 50, we give priority to purchases, below - to sales;
- intersections of two lines - signal and main - are also indicative, especially if this happened in overbought/oversold zones, predicting a price reversal.

Common tricks that do not work on Stochastic RSI:
- trading based on divergences;
- reversal patterns, trend lines, etc.
The Stochastic RSI Oscillator will be useful for both beginners and experienced traders; it is quite effective for predicting RSI extremes, but remember that any tool can only be used in combination with others for more reliable filtering of false signals.
Download the Stochastic RSI indicator
Can't figure out how this strategy or indicator works? Write about it in the comments to this article, and also subscribe to our YouTube channel WinOptionSignals , where we will definitely answer all your questions in the video.
See also:


To leave a comment, you must register or log in to your account.