 Strategies that come from Forex require a lot of time to adapt to binary options trading . Novice traders in the binary options market strive for quick profits. If, when using a specific strategy, it is not possible to achieve profit within 3–10 trades, work on it is stopped. The trader moves on to search for another strategy, without taking into account the fact that several transactions are not enough to understand the effectiveness of the actions used.
A month is the minimum period for testing the strategy used in binary options. Otherwise, it will not be possible to objectively determine whether there will be a profit or not. At the same time, at the final stage, it is necessary to exclude the demo account. Trading without real money has little connection to reality. A good way to test a particular strategy can be the BOsimulator indicator .
In our case, we will analyze the “Bomb” strategy for binary options, which can provide at least 70% of profitable transactions monthly in long-term trading.
Indicators used in the strategy
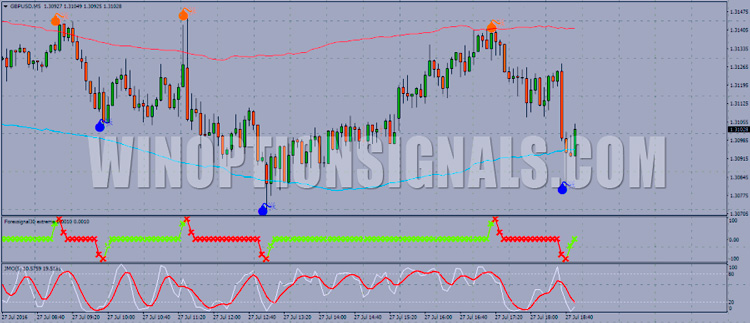
FTI Top Bottom – look for it on the main chart. The source of relevant information is the ZigZag indicator. Binary options signals received at the input are displayed as bombs. Blue – buy, red – sell.
TMA Bands is a variant of the Envelopes type channel indicator located on the main chart. The line below is blue, and the line above is red. The work is based on breaking through candles.
Forexsignal30 extreme – fluctuations displayed in the lower window, which comes first. The occurrence of a signal initiated by buying or selling leads to the formation of peaks.
JMO is an indicator that reflects accurate readings, the location of which is determined by the lower window. It is distinguished by the presence of zones that form due to overbought or oversold conditions. Finds application as a filter.
Trading Rules
The Bomb strategy is subject to the following rules:
- asset – the specific choice does not matter;
- start of trading – manifestation of volatility;
- timeframes – from M5;
- option closing (expiration time) – in the range of 4–12 candles.
Entries into specific positions depend on buy and sell signals.
Opening a buy deal (call options)
- TMA Bands – breakdown of the lower border.
- FTI Top Bottom - the appearance of a bomb colored blue.
- Forexsignal30 extreme – the top of the chart, directed towards the entrance to the oversold zone, followed by a demonstration of a reversal, which changes the red color to green.
- JMO – when below level 20, it moves upward from this border.
Opening a sell transaction (put options)
- TMA Bands – exceeding the limit determined by the lower limit.
- FTI Top Bottom – red bomb formation.
- Forexsignal30 extreme – reaching the top point in the immediate vicinity of the oversold zone is accompanied by a change in red to green.
- JMO – overcoming level 20 with a further increase when the starting position was below this mark.
Useful advice, using the example of a signal on a 5-minute chart:
Wait until the candlestick channel touches or breaks through and only then open a position. There is no need to rush, even if other indicators are sending a signal. The channel is more important than indicators, since the latter adapt to the market. JMO is a filter that requires special attention. It is impossible for it to remain permanently in zones formed due to oversold or overbought markets; exit will definitely occur. This is the moment to look forward to. Skip the news and focus on the channel breakout. In relation to M5, 10–12 candles are enough for expiration, which in relation to H4 looks like 2 or 3 candles.
Can't figure out how this strategy or indicator works? Write about it in the comments to this article, and also subscribe to our YouTube channel WinOptionCrypto , where we will definitely answer all your questions in the video.


To leave a comment, you must register or log in to your account.