
The actions of exchange trading participants are determined by the influence of certain factors, both external and internal. Traders’ actions are influenced by specific patterns, the analysis of which allows one to predict future price movements. However, this is a serious problem: there are many factors whose impact changes the direction of the trend. And not all of them are interpretable.
At the same time, patterns often form on the trading chart, which are easy to work with. These include the “Three Candles” pattern, on the basis of which you can build a further strategy of behavior.

Features of the strategy
As part of the strategy built on the basis of the Three Candlesticks pattern, you can use any time frame. It is recommended to use major currency pairs, set the expiration time for one candle and trade at a time when the American or European session is open.
The Three Candles pattern is formed at the point where two trends connect. Outwardly it looks like a fractal. The pattern is a combination of three candles, where the maximum and minimum purchase prices near the middle are located below similar points of neighboring figures. In addition, this pattern is formed if the closing price of the last two candles corresponds to the current trend direction. In other words, on the chart these two candles are colored white (if we are talking about a purchase).
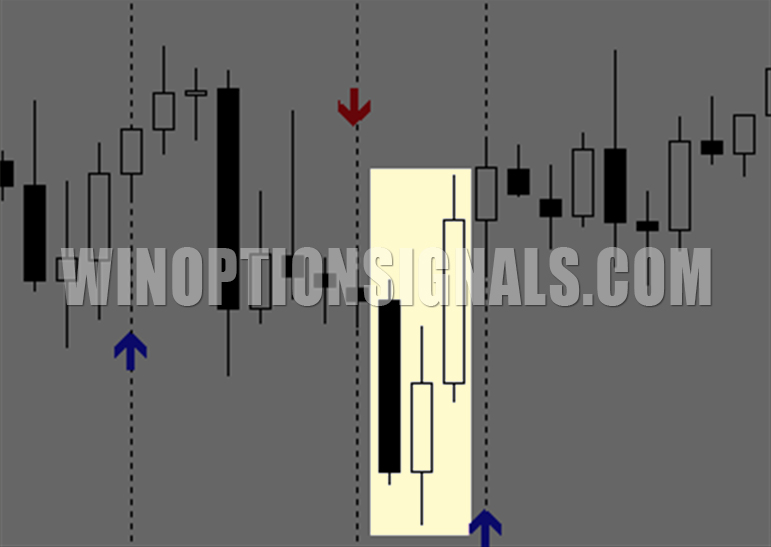
The pattern used to make a purchase has the shape of a depression. The figure for sale resembles a cap. The last pattern has the maximum and minimum prices of the middle candle above similar points and two neighboring ones. As in the above case, if we are talking about selling, then the last two candles on the chart should be colored black. This indicates a downward trend.

To identify the pattern in question on the chart, you can use the 3rd Candle auxiliary indicator. The tool shows when the desired pattern appears by placing a red or blue arrow on the chart. If it is directed upwards, then it is necessary to open a buy transaction, downwards - a sale.
The strategy under consideration allows operations to be carried out during a time period convenient for the trader. Maximum results can be achieved if you set a time frame greater than 1 hour. However, using this pattern, it is possible to make a good profit on the minute chart. But in this case, the trader will face a large number of false signals. It is important not only to use the pattern, but also the appropriate oscillators. The latter cut off most false signals, thereby preventing the opening of a trade against the trend.
This trading strategy uses the CCI oscillator, which is represented on the chart as lines. It shows zones, entering which indicates that the asset is overbought or oversold. In the first case, the value exceeds 100, in the second – below -100. When working with this tool, you need to remember that if the current value exceeds the first indicator, you cannot open a buy deal; if below the second indicator - for sale.
Trading using the Three Candles pattern is carried out only during trend corrections or reversals of the current trend. Therefore, this strategy is not suitable for beginners. The main thing is to wait for the signal to be confirmed and then open a deal. In this case, the system functions properly.
How to trade
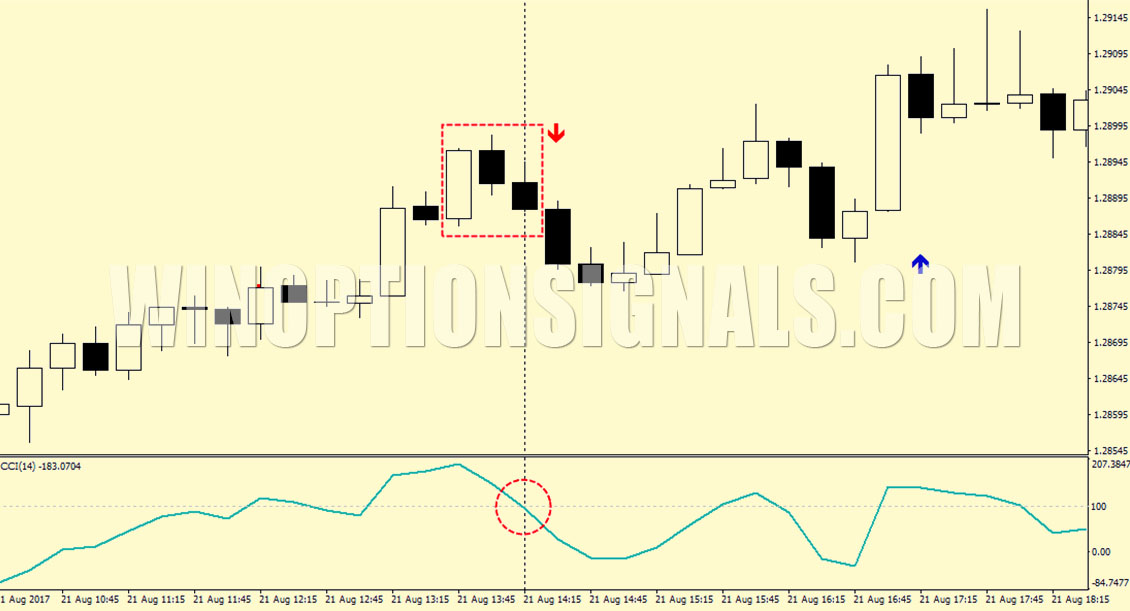
Before making a transaction to buy an option, you must wait for the blue arrow pointing up to appear on the chart. In addition, the CCI oscillator on the previous candle should not exceed the value of 100.
When buying a Put option, you need to wait until a red arrow pointing down appears on the chart. The oscillator on the previous candle should be above the -100 value.
Expiration is set one candle at a time within the selected time period. The maximum deposit amount for each transaction should not exceed 3% of the current deposit.
Examples of work
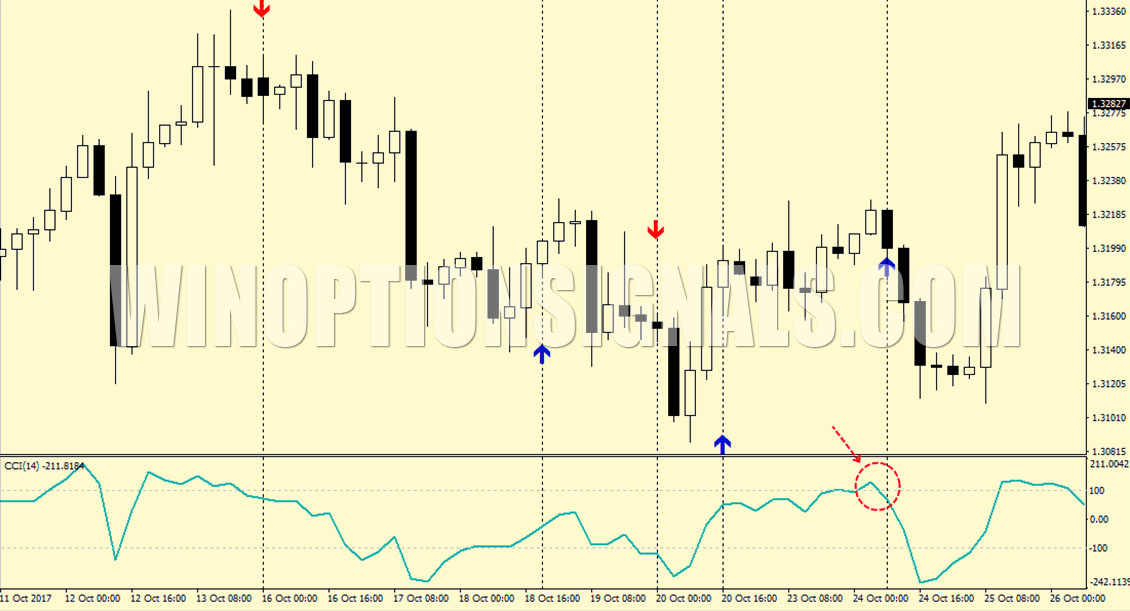
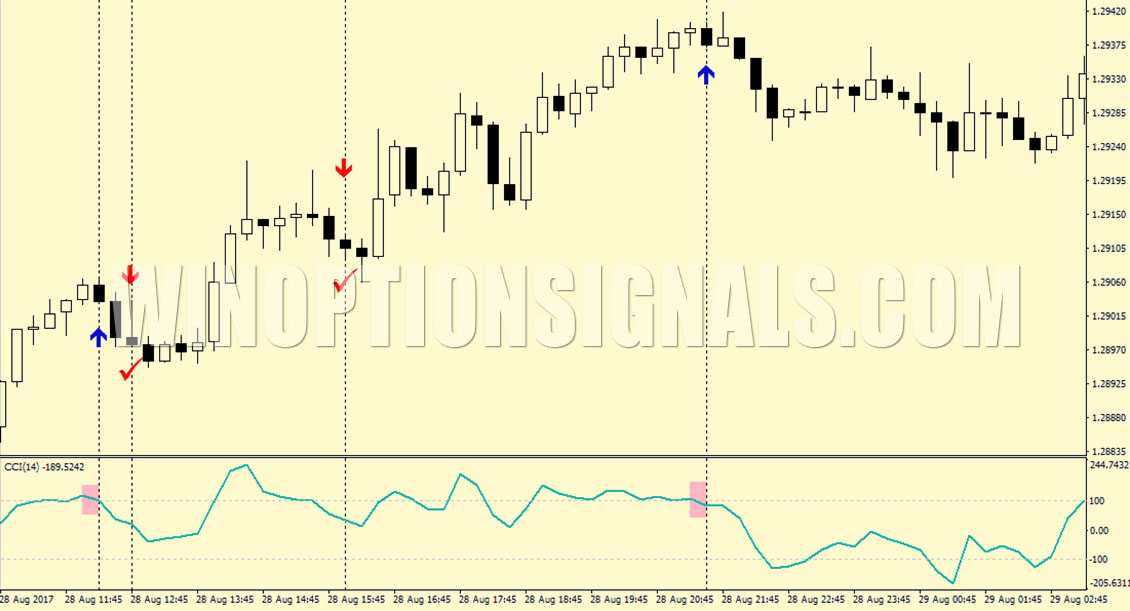
For example, the GBP/USD pair was selected, transactions for which are made on the 15-minute chart. The latter demonstrates that buy signals appear late. And out of four sales transactions, only two were successfully completed. It is possible to avoid unprofitable operations due to the oscillator, which indicates the presence of overbought conditions. In this case, you cannot carry out operations to buy a Call option.
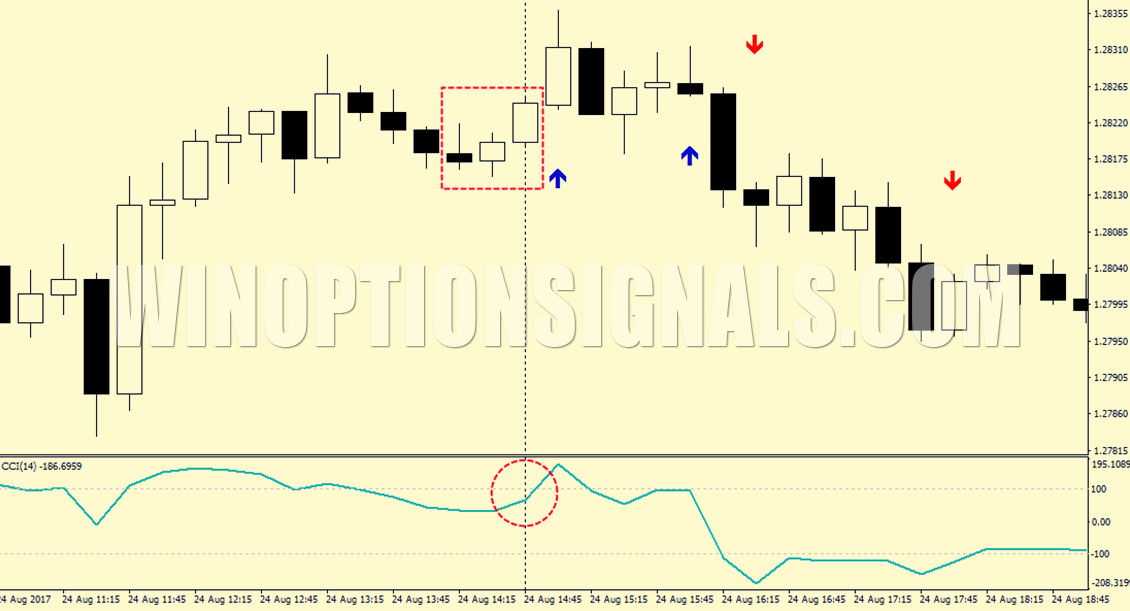
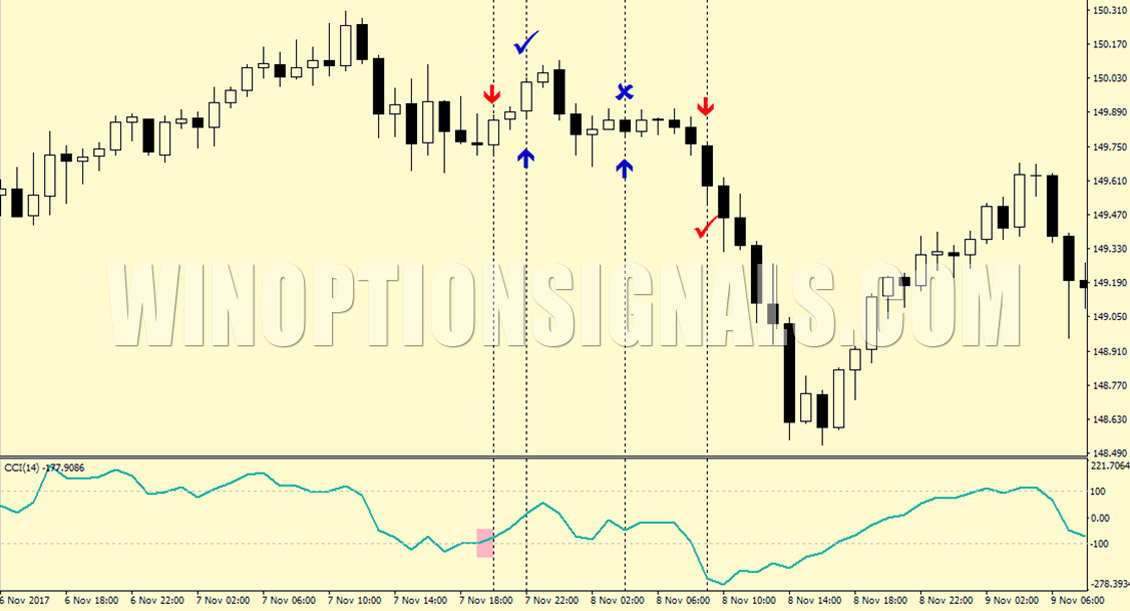
Volatile pairs like GBP/JPY are optimal in terms of profitability. In the chart above, the first Put signal appeared in the overbought zone, so you should not pay attention to it. The last 2 transactions with Call and Put completed successfully.
The Three Candles strategy is relatively simple. It can be used to train trader psychology. The reason for this is that trading within the framework of this strategy is carried out in conditions of a market reversal. However, it can bring good profits when working with binary options.
Download the three candles indicator
Can't figure out how this strategy or indicator works? Write about it in the comments to this article, and also subscribe to our YouTube channel WinOptionCrypto , where we will definitely answer all your questions in the video.
See also:
To leave a comment, you must register or log in to your account.