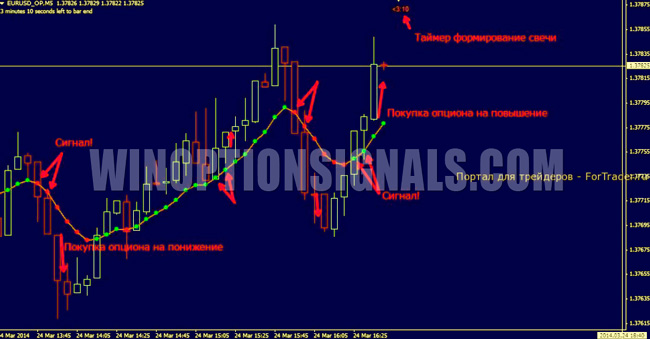
This algorithm is based on predicting the behavior style of the third candle (special indicators will help). A fairly simple method, because you just need to analyze the trading chart of the currency pair and the first 2 candles.
Basic settings of the “Third Candle” strategy
- Recommended currency pairs: British pound/US dollar and euro/dollar.
- Time frame of the chart: 5 minutes and fifteen.
- Trading time: any
- Indicators used in the strategy: Var Mov Avg3 (based on the moving average), b-clock.
If you carefully look at the picture above, you can see that the presented Var Mov Avg3 indicator is nothing more than an indicator of the direction of the trend (a line with green and red dots).
Signals from the “Third Candle” strategy to buy a CALL option
We are waiting for two green candles to form on the chart. At the same time, two green dots will appear on the Var_Mov_Avg3 indicator line, indicating a transition to an uptrend. When this happens, we wait for the second candle to close completely and purchase an option to increase. It is important that the second candle closes higher than the first.
Signals from the “Third Candle” strategy to buy a PUT option
You should wait until two red candles form on the chart and two red dots appear on the Var_Mov_Avg3 indicator line. We are waiting for the second candle to close below the level of the first. Then we open a put option (PUT)
Can't figure out how this strategy or indicator works? Write about it in the comments to this article, and also subscribe to our YouTube channel WinOptionCrypto , where we will definitely answer all your questions in the video.


To leave a comment, you must register or log in to your account.