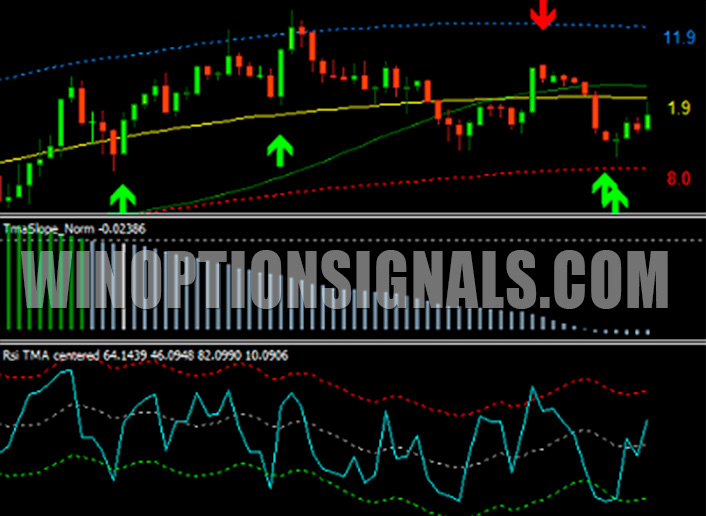
Triangular Moving Average (TMA) is a channel indicator that remains relevant on various time frames (without redrawing). It is built on the basis of moving averages. The indicator appeared relatively recently, so metatrader developers do not yet include it in their tools. Moreover, TMA is available for free download.
An important feature of indicators from other similar tools is that they use double-smoothed moving averages to estimate probabilities. Due to this, the trader will be able to more accurately determine the current direction of the trend. In addition, thanks to the described feature, the indicator reacts less sensitively to false signals.

Due to the high popularity of TMA, many of its modifications have appeared on the Internet. Some of the available versions of the indicator allow you to develop new strategies for working with binary options. Among them, the RSI TMA Centered Bands modification should be highlighted. Its features will be discussed below.
Instructions for installing indicators in MetaTrader 4 :
Terms of trade
RSI TMA Centered Bands is a hybrid tool that combines the characteristics of a channel TMA and an RSI oscillator. The new combination turned out to be successful, as it allows you to simultaneously evaluate:
- the probability of a change in trend direction towards growth or decline;
- The degree to which the selected option is overbought or oversold.

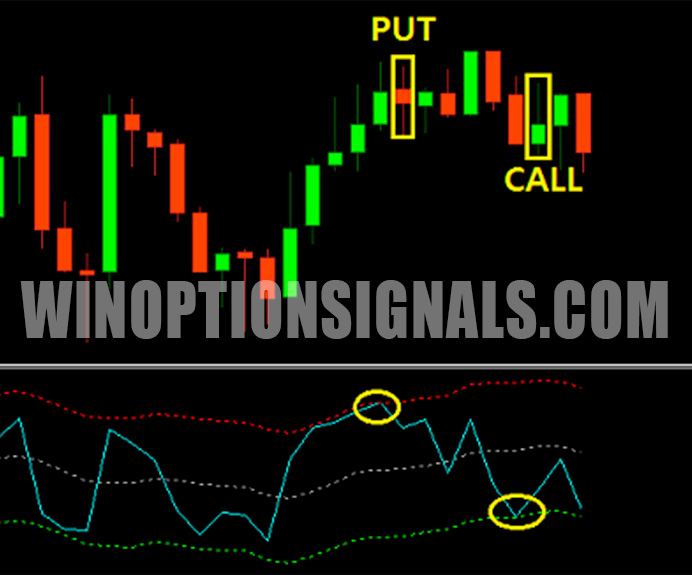
This indicator signals an imminent change in upward trend direction when the oscillator line rises above the central TMA line. A probable fall in the value of an asset is indicated by a chart on which the RSI is below the TMA line.
In addition, an asset is overbought when the RSI line is above the upper line of the TMA indicator; oversold – RSI line below the lower TMA line.
The modification under consideration uses an oscillator with a small period. The default value is three. Therefore, it is not recommended to apply RSI TMA Centered Bands to a period of more than two candles.
Using additional filters
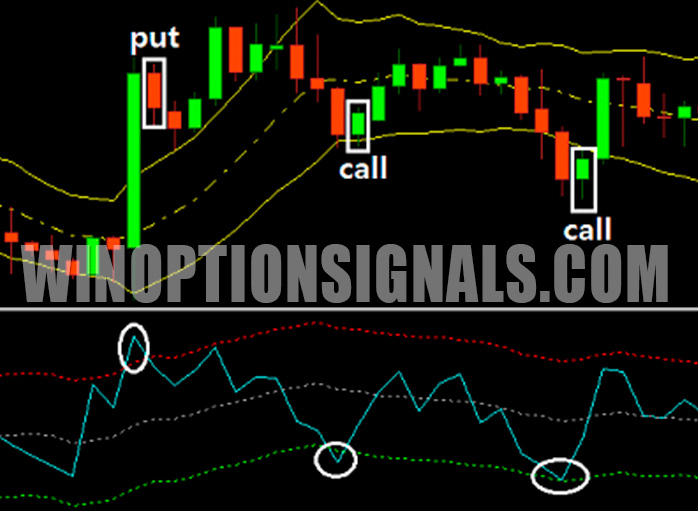
RSI TMA Centered Bands includes two filters that smooth each other's signals. But to check the received signals for binary options, you should use additional tools. Among the possible options for such combinations, it is worth considering Kellner channels.

If you use a combination of RSI TMA Centered Bands with the specified instrument, then to buy a Put option you should wait for two components to appear simultaneously on the chart:
- the RSI line is located above the upper TMA line;
- the current price has risen above the upper band of the Kellner channel.
To buy a Call option, you should wait for the opposite situation:
- RSI dropped below the lower TMA line;
- the price is located below the lower band of the Kellner channel.
Using the described combination, you should pay attention to reversal candlestick patterns. However, it is not recommended to trade during periods of high market volatility caused by news releases.
The TMA indicator is considered a profitable tool among traders. It can be used in various strategies. However, this indicator is not able to completely protect the trader from losing trades. Therefore, when working with TMA, you must always use other market analysis tools.
Download the RSI-TMA indicator |
Download the RSI-TMA-Arrows indicator |
Can't figure out how this strategy or indicator works? Write about it in the comments to this article, and also subscribe to our YouTube channel WinOptionCrypto , where we will definitely answer all your questions in the video.


To leave a comment, you must register or log in to your account.