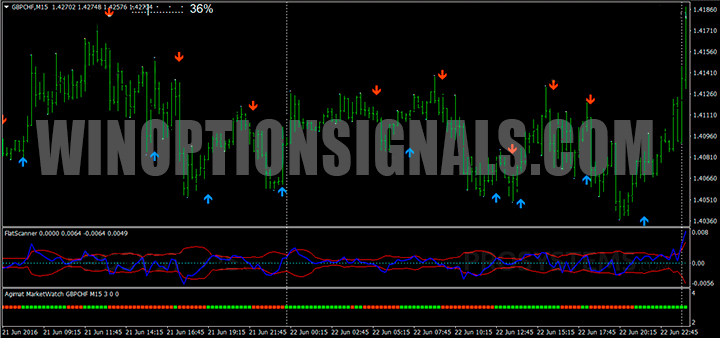
The Market Scanner Binary System strategy is built on the data of four indicators and has a clear interface even for beginners. This binary options strategy helps identify trend indicators, which are further filtered by custom indicators . This strategy can be applied to any assets. It is recommended to trade on the M5 and M15 time frames and after the opening of the American and European sessions , when the market is most active. The expiration period should be set at 15 (for signals on M5) and 30 minutes (for signals on M15).

When to make a buy trade (CALL)
Using this trading strategy, it is recommended to buy Call options with a simultaneous combination of the following factors:
- trend lines have an upward direction;
- a blue arrow pointing upward has formed on the chart;
- the blue line of the FlatScanner indicator has broken through the upper channel border;
- The Agimat MarketWatch indicator signals green.

When to make a sell trade (PUT)
Put options should be purchased if:
- trend lines have a downward direction;
- a red arrow pointing down appears on the chart;
- the blue FlatScanner line has broken through the lower channel boundary;
- A red square lights up on the Agimat MarketWatch indicator.

The Market Scanner strategy is a set of indicators that, when used correctly, provide up to 75% of profitable trades. If they have sufficient experience working with binary options, traders can supplement this system with their own indicators, thereby further increasing the effectiveness of this trading strategy.
Download indicators and strategy template Market Scanner
Can't figure out how this strategy or indicator works? Write about it in the comments to this article, and also subscribe to our YouTube channel WinOptionCrypto , where we will definitely answer all your questions in the video.
See also:
How to choose a binary options broker


To leave a comment, you must register or log in to your account.